Matrix Blog

Posts Tagged ‘Calculator’

2017: The Year The 2015 Manhattan Market Shift Became Conventional Wisdom

January 1, 2018 | 11:00 am | | Charts |

After controlling the Manhattan housing market for quite a while, sellers and landlords exchanged roles with buyers and tenants circa 2015.

After peaking in 3Q 2015, the market share of bidding wars fell by two thirds. Bidding wars remain more common at lower price points. After bottoming in the 3Q 2015, the market share of rentals with landlord concessions has expanded sharply due to high-end rental development over-building. But like the sales market, the oversupply remains at the upper end.

Aside

Sunday, December 31, 2017, was a trifecta of my New York Times Real Estate market insight goodness before the year ended:

Landlords and Sellers Adjust [New York Times: Calculator column]

Manhattan Prices Stable in 2017, Even as Luxury Takes a Breather [New York Times: Big Ticket column]

Ditching the Tub [New York Times]

Tags: , ,


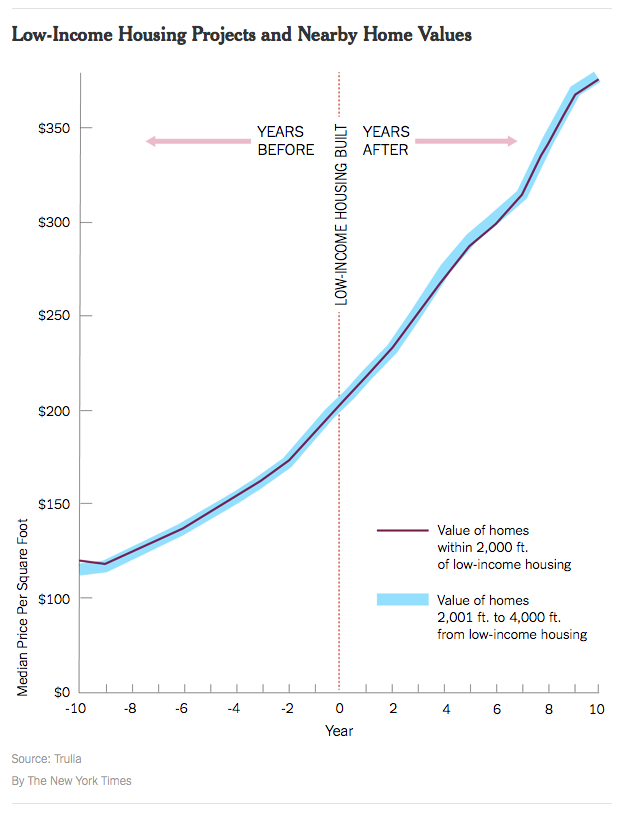
YIMBY: Low-Income Housing

November 25, 2016 | 2:02 pm | | Infographics |

lowincomevvaluetrulianyt

The YIMBY (Yes-In-My-Backyard) movement is fairly new.

In the United States, early leaders of the YIMBY movement include Sonja Trauss in San Francisco and Nikolai Fedak in New York. The first ever Yes In My Backyard conference was held in Boulder, Colorado, in June 2016.

Nikolai has done an amazing job at chronicling the explosion of new development in NYC over the past several years with his must read web site New York YIMBY.

One of the misconceptions with the NIMBY movement which is largely the opposite of YIMBY is the idea/rule of thumb that low-income housing always drags down property values of nearby properties. In an era challenged by the lack of any type of affordable housing, this makes a bad situation worse.

According to this recent research by Trulia (FYI – I was part of their industry advisory board from 2006-2014), and notably in aggregate form, the impact seems to be non-existent in the majority of the markets covered. One can’t conclude there is no impact as a general rule but it does show that should not be the default assumption.

The above infographic is from this Weekend’s New York Times’ real estate section column called ‘Calculator’ – Low-Income Housing: Why Not in My Neighborhood?. The methodology used in the Trulia research was the following:

To measure this, Trulia compared the median price per square foot of nearby homes (within 2,000 feet of low-income housing) with that of homes farther away (2,001 to 4,000 feet) over 20 years, starting 10 years before the low-income housing was built and ending 10 years after.

Tags: , , , ,


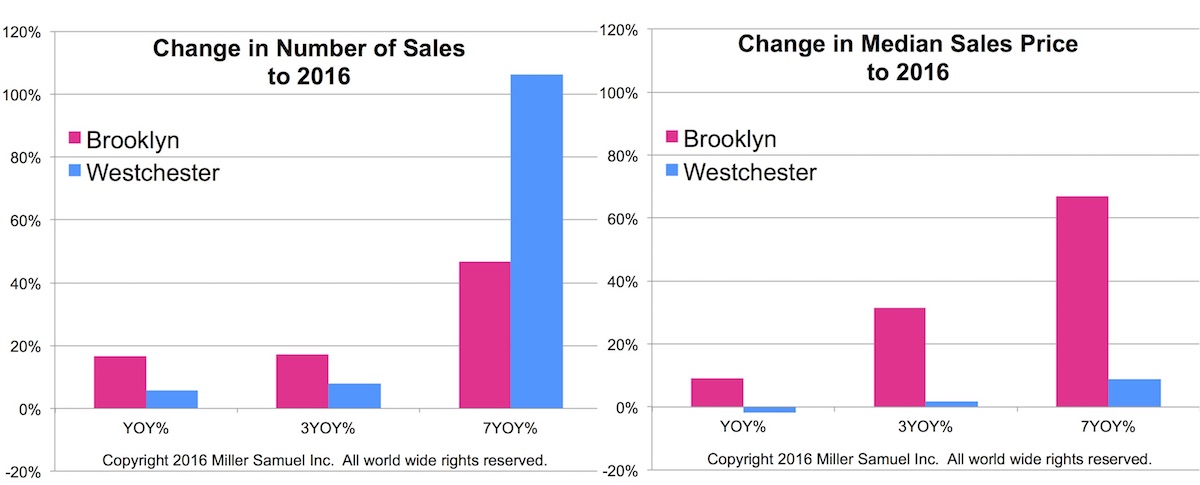
NYT Calculator: Suburban Sales Boom Measured By Houses on Monopoly Board

November 19, 2016 | 7:46 am | | Charts |

The New York Times created another super cool graphic in their new Calculator column, based on my idea. In the fall of 2015 I observed a massive surge of sales in Westchester County (north of NYC for those not familiar with our area). However median sales price was nearly flat during this period. This was phenomenon repeated in all of the counties that surround NYC – except for NJ since I don’t cover that market yet but anecdotally I believe the same phenomenon is occurring there. I believe this moment was the point where the affordability challenge became so severe that renters and move up buyers had to move out of the city.

Specifically, Brooklyn showed a surge in median sales price from 2009 with a modest growth in sales. Westchester reflected the opposite patterns of Brooklyn. Westchester county sales boomed over the same period while the growth in median sales price was much more tepid.

westchestervbrooklyn11-2016

Below is the NYT graphic for the suburban sales boom article.

11-18-16nytcalculator

Tags: , , ,

Get Weekly Insights and Research

Receive Jonathan Miller's 'Housing Notes' and get regular market insights, the market report series for Douglas Elliman Real Estate as well as interviews, columns, blog posts and other content.

Follow Jonathan on Twitter

#Housing analyst, #realestate, #appraiser, podcaster/blogger, non-economist, Miller Samuel CEO, family man, maker of snow and lobster fisherman (order varies)
NYC CT Hamptons DC Miami LA Aspen
millersamuel.com/housing-notes
Joined October 2007