Skip to content
Services
Appraisals
Consulting
Resources
Market Reports
Charts
Matrix Blog
Articles & Research
Press
About
get in touch
Charts
› Economy
February 14, 2013
Celebrity, Pop Culture
,
Douglas Elliman
,
Economy
,
Federal Reserve Bank
,
Federal Reserve, New York
,
Housing Indices & Portals
,
RealtyTrac
,
The Real Deal
Housing Data as Pop Culture
read more
January 28, 2013
Economy
,
Homebuying Process
,
Housing Indices & Portals
,
Language, Jargon & Quotes
,
New York Times
,
RealtyTrac
Falling Inventory Has Created a Housing “Pre-Covery,” not “Recovery”
read more
December 26, 2012
Economy
,
Government, Politics, Regulations & Policy
,
Homebuying Process
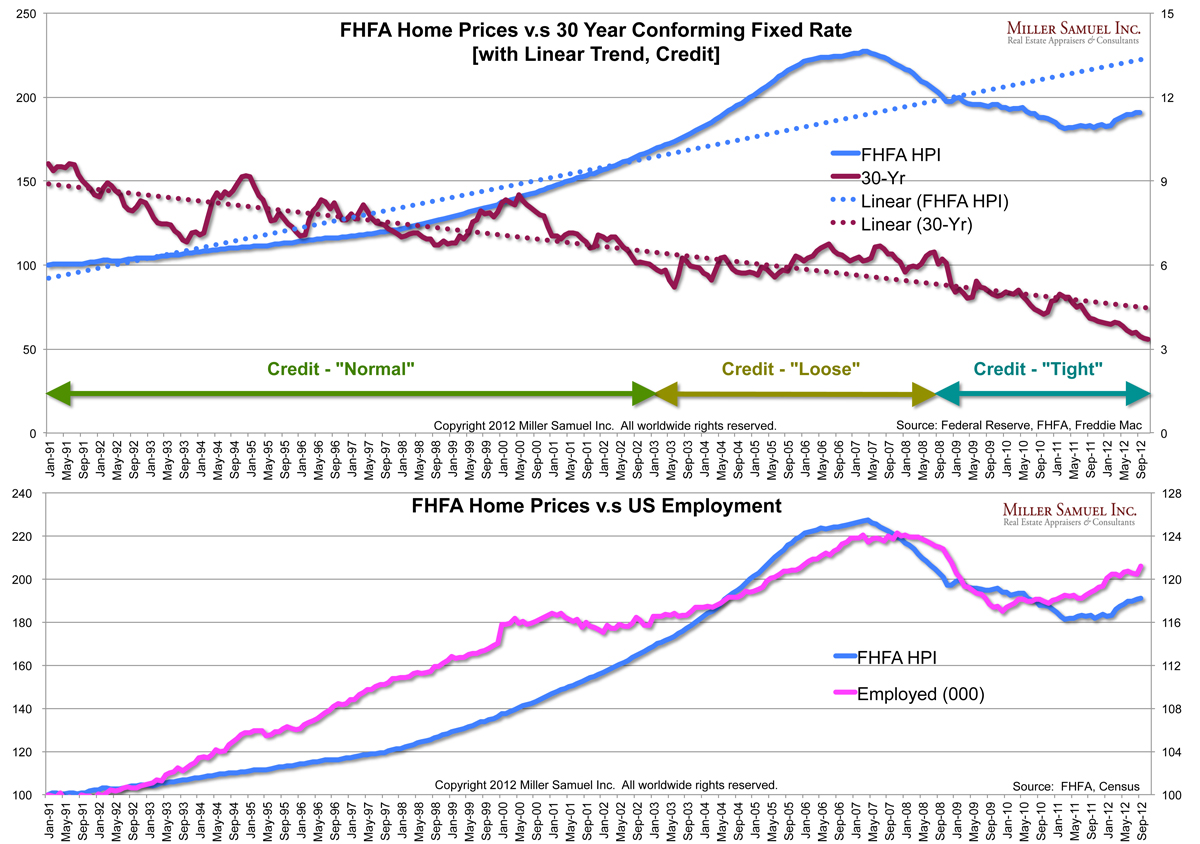
Yes, Mortgage Rates Impact Housing Prices
read more
September 23, 2012
Economy
,
The Housing Helix
,
Wall Street, Financial Services
[The Housing Helix Podcast] Barry Ritholtz Part 2
read more
September 23, 2012
Books & Movies
,
Economy
,
The Housing Helix
,
Wall Street, Financial Services
[The Housing Helix Podcast] Barry Ritholtz Part 1
read more
June 21, 2012
Economy
,
International
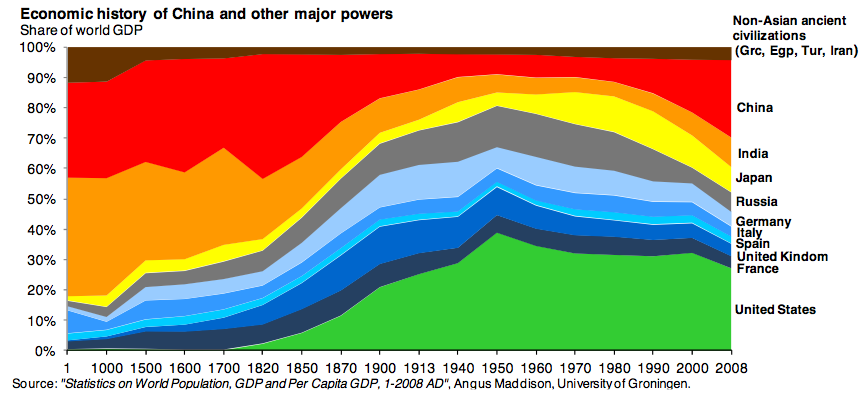
[The Atlantic] 2000 Years of Economic Power Measured by GDP
read more
May 21, 2012
Economy
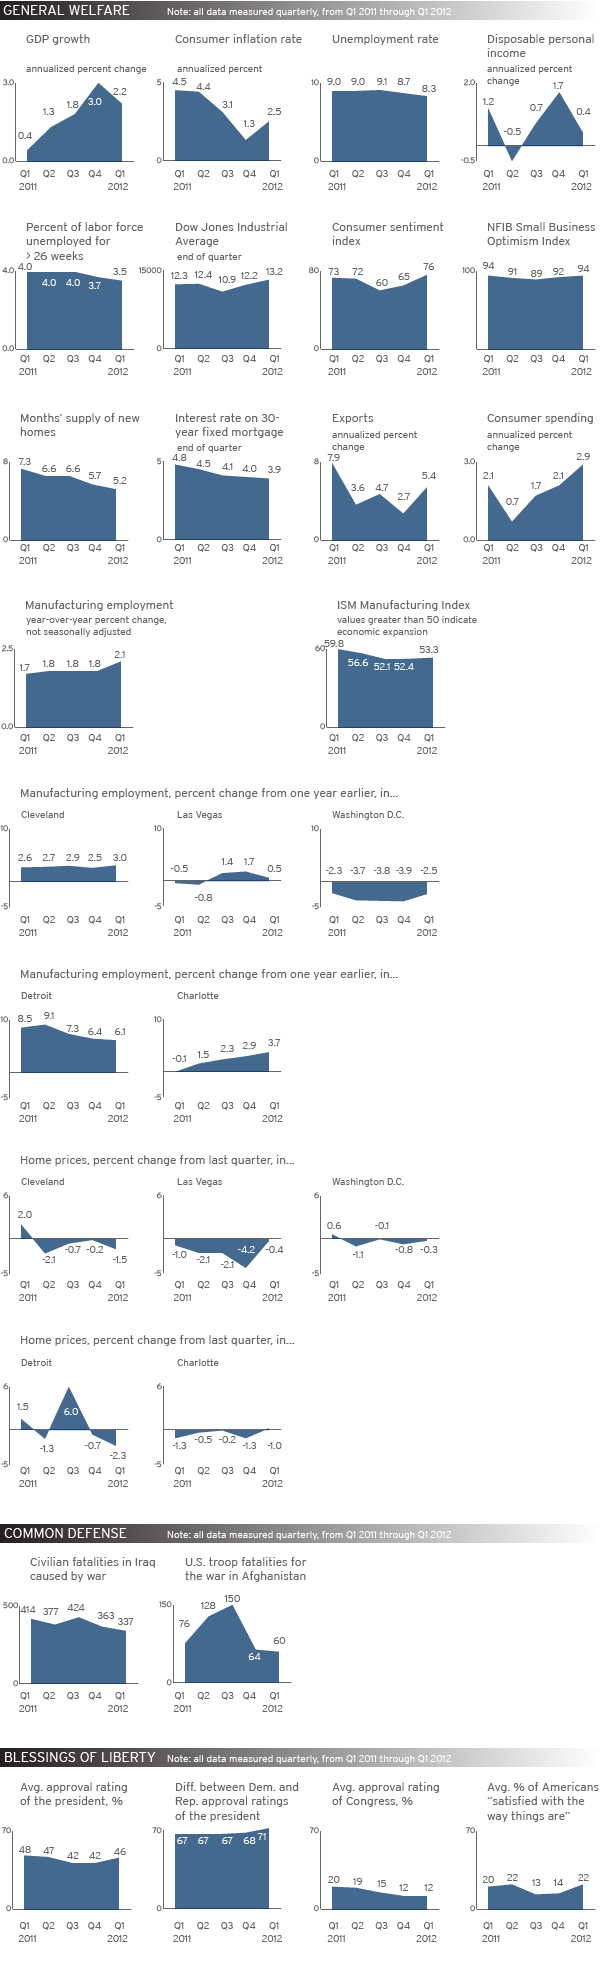
[Brookings] How We’re Doing Index – May 2012
read more
February 7, 2012
Boom Bubble Bust
,
Economy
,
New York Times
,
Wall Street, Financial Services
Buying Manhattan Apartments with Gold
read more
October 6, 2011
Books & Movies
,
Distressed Housing
,
Economy
,
Interviews
,
The Housing Helix
[Interview PART II] Barry Ritholtz, CEO, Director of Equity Research, Fusion IQ, Author, Bailout Nation, The Big Picture Blog
read more
October 5, 2011
Books & Movies
,
Economy
,
Interviews
,
The Housing Helix
[Interview PART I] Barry Ritholtz, CEO, Director of Equity Research, Fusion IQ, Author, Bailout Nation, The Big Picture Blog
read more
January 21, 2011
Books & Movies
,
Economy
,
Interviews
,
New York Times
,
The Housing Helix
[Interview] Barry Ritholtz, CEO, Director of Equity Research, Fusion IQ, Author, Bailout Nation, The Big Picture Blog
read more
December 21, 2010
Books & Movies
,
Economy
,
Interviews
,
The Housing Helix
[Interview] Mark Zandi, Chief Economist, Moody’s Analytics, Author, Financial Shock & Paying the Price
read more
Previous
2
3
4
Next
Load More Posts
Page load link
Go to Top