Matrix Blog

Posts Tagged ‘New York Times Real Estate Section’

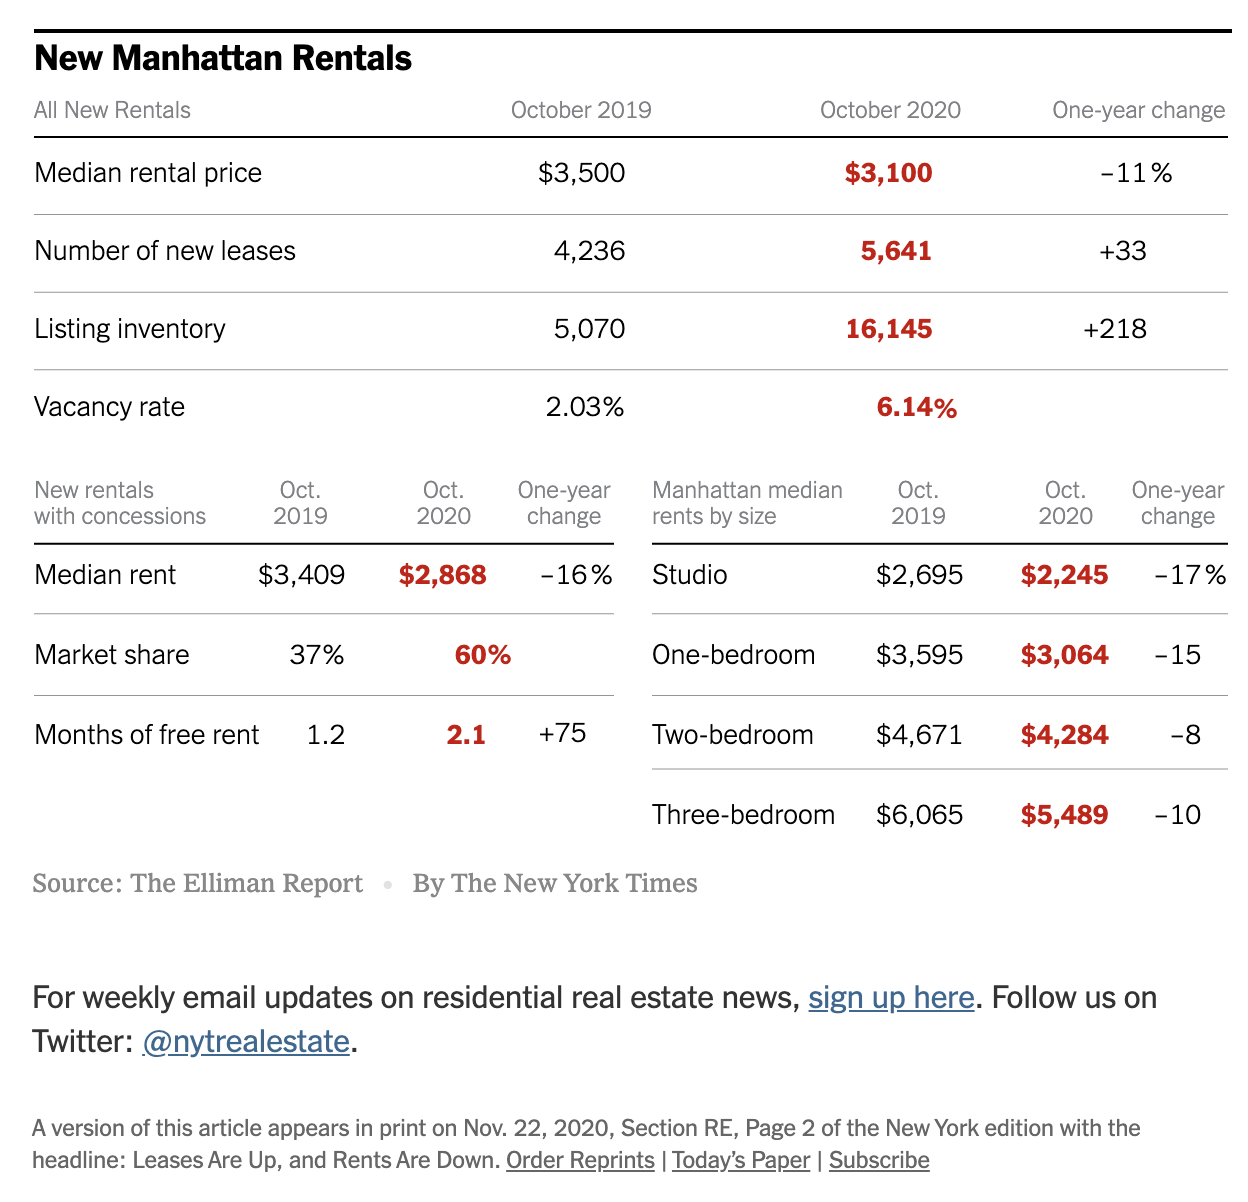
NYT Real Estate: Signs of a Manhattan Rental Market Recovery

November 21, 2020 | 12:49 pm | | Charts |

This weekend’s New York Times Real Estate Calculator column provides a visualization of the recent rental market results in The Elliman Report: October 2020 Manhattan, Brooklyn & Queens Rentals

The Manhattan changes were the most interesting to me – record highs set for the vacancy rate, concession market share, concession amount, yoy% change in median net effective rent overall, studio, 1-bed, & 2-beds. Yet we saw for the first time in fourteen months, a jump in YOY% new lease signings and the highest October new lease signing total on record.

The significantly weaker rental market final hit a point that caused demand to begin to flood back into the market.


[click to open article]

Tags: , , ,


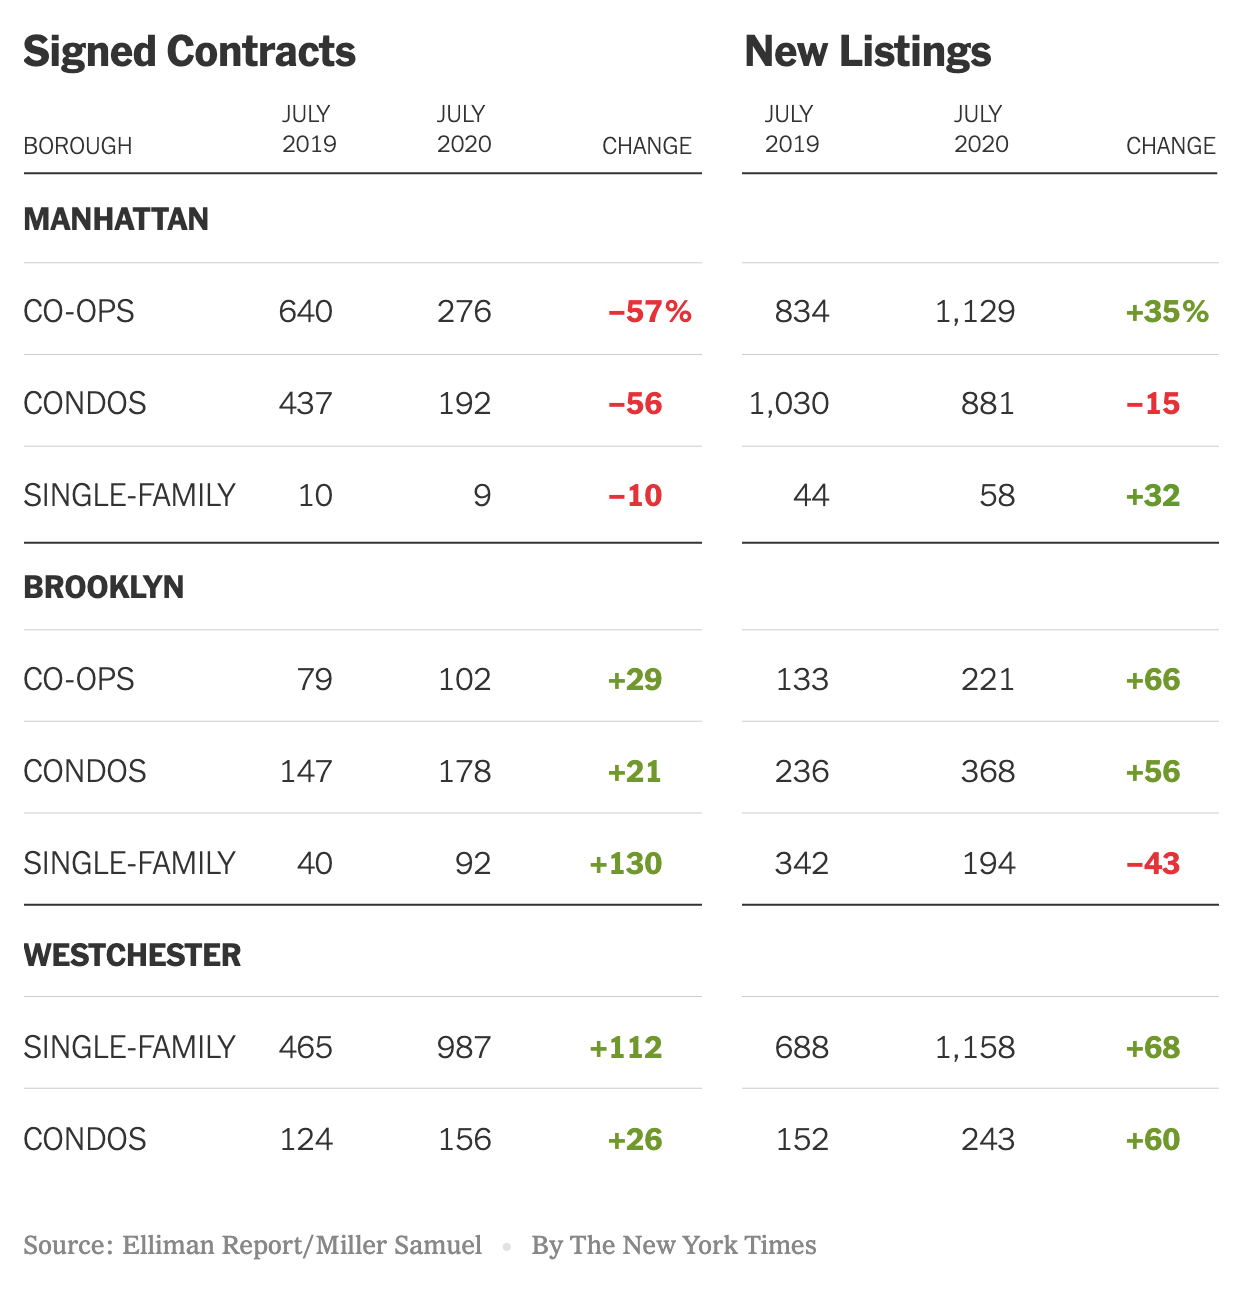
The ‘Urban To Suburban’ Narrative Is Really ‘Manhattan To Suburban’

August 19, 2020 | 1:26 pm | | Charts |

This post previously appeared in the August 14, 2020 edition of Housing Notes. I’ve been writing these weekly summaries on housing topics for more than five years. To subscribe for free, you can sign up here. Then you can look forward to each issue every Friday at 2pm New York Time.

The New York Times created a terrific graphic on our Elliman New Signed Contract Report by illustrating the performance of Manhattan and Brooklyn versus Westchester County. Brooklyn’s sales market performance is closer to Westchester than it is to its city counterpart.


Tags: , , , ,


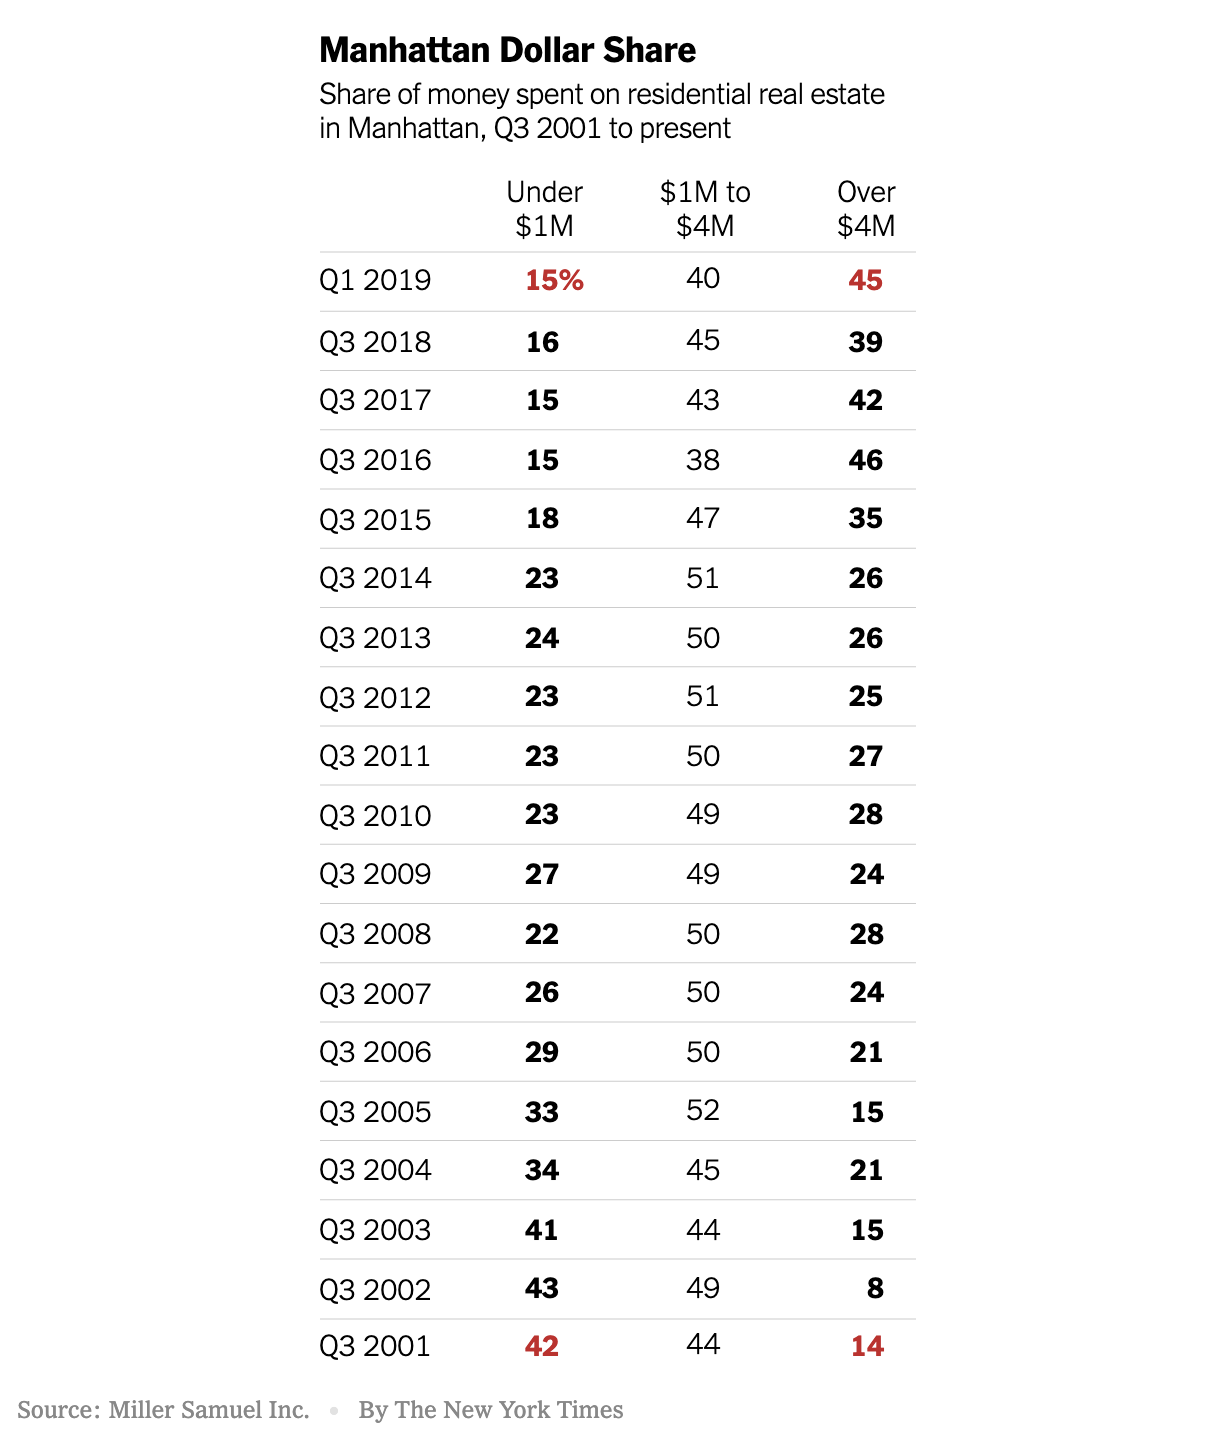
NYT Infographic: Manhattan Real Estate Shift To High End, Illustrated

May 4, 2019 | 11:03 am | | Infographics |

There is a cool graphic from the New York Times Calculator column by Michael Kolomatsky in this Sunday’s print edition of the Real Estate section that illustrates Manhattan’s dependence on high-end real estate. Using the data from a chart I began right after 9/11 and we continue to update, he illustrates this point:

Almost half the money spent by New York City home buyers in the first quarter of 2019 went toward the most expensive properties. That wasn’t always the case.


Tags: , ,


2017: The Year The 2015 Manhattan Market Shift Became Conventional Wisdom

January 1, 2018 | 11:00 am | | Charts |

After controlling the Manhattan housing market for quite a while, sellers and landlords exchanged roles with buyers and tenants circa 2015.

After peaking in 3Q 2015, the market share of bidding wars fell by two thirds. Bidding wars remain more common at lower price points. After bottoming in the 3Q 2015, the market share of rentals with landlord concessions has expanded sharply due to high-end rental development over-building. But like the sales market, the oversupply remains at the upper end.

Aside

Sunday, December 31, 2017, was a trifecta of my New York Times Real Estate market insight goodness before the year ended:

Landlords and Sellers Adjust [New York Times: Calculator column]

Manhattan Prices Stable in 2017, Even as Luxury Takes a Breather [New York Times: Big Ticket column]

Ditching the Tub [New York Times]

Tags: , ,

Get Weekly Insights and Research

Housing Notes by Jonathan Miller

Receive Jonathan Miller's 'Housing Notes' and get regular market insights, the market report series for Douglas Elliman Real Estate as well as interviews, columns, blog posts and other content.

Follow Jonathan on Twitter

#Housing analyst, #realestate, #appraiser, podcaster/blogger, non-economist, Miller Samuel CEO, family man, maker of snow and lobster fisherman (order varies)
NYC CT Hamptons DC Miami LA Aspen
millersamuel.com/housing-notes
Joined October 2007