Skip to content
Services
Appraisals
Consulting
Resources
Market Reports
Charts
Matrix Blog
Articles & Research
Press
About
get in touch
Charts
› Absorption
September 22, 2015
Analysis & Research
,
Charts, Maps, Images, Infographics, Video
,
Manhattan
,
Sales
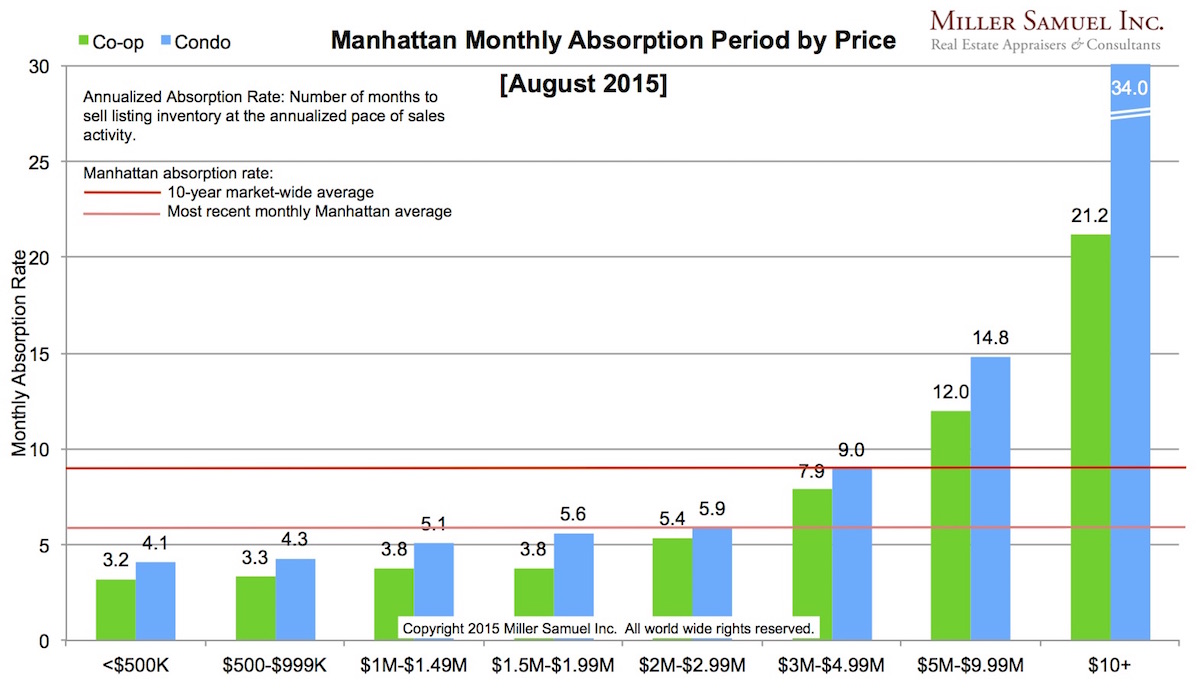
Manhattan Monthly Absorption Rate – August 2015
read more
November 30, 2014
Bloomberg View
,
Boom Bubble Bust
,
Charts, Maps, Images, Infographics, Video
,
Housing Trends & Cycles
,
Junk Statistical Analysis, Luck, Superstition and Coincidence
Bloomberg View Column: Housing’s Misleading Health Indicator
read more
October 4, 2014
Charts, Maps, Images, Infographics, Video
,
Manhattan
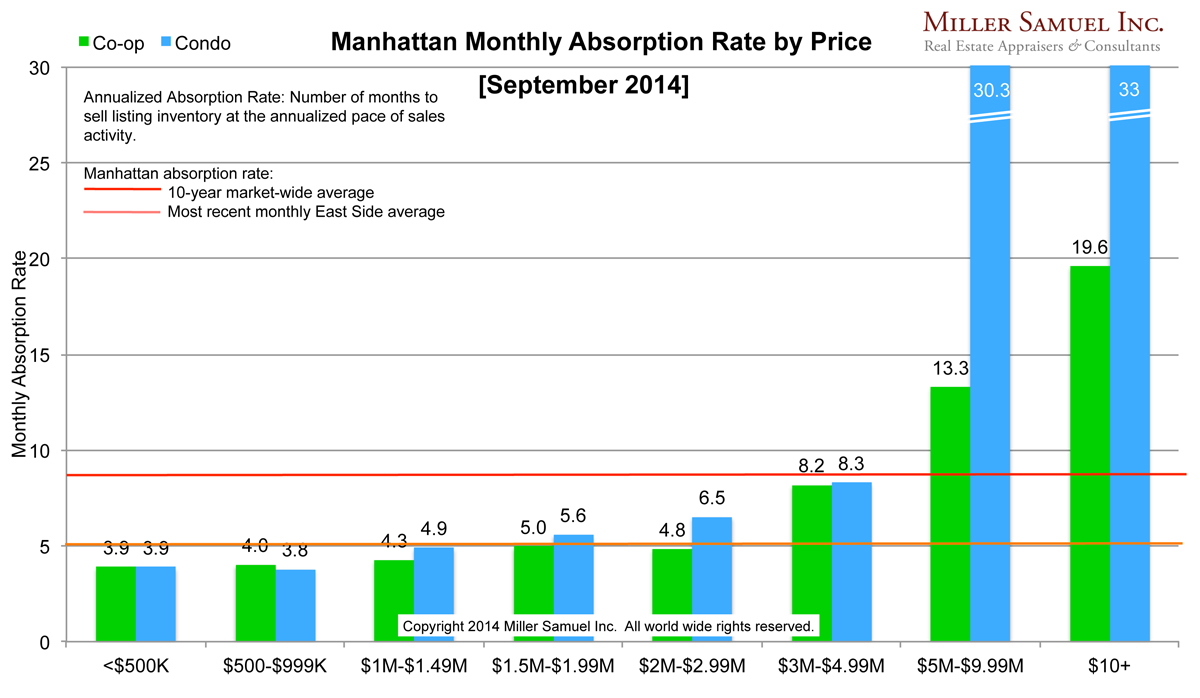
[Manhattan Absorption] September 2014 – While All Markets Cool, Sub $3M Remains Brisk
read more
September 27, 2014
Affordability, Affordable Housing
,
Blogging Off The Matrix
,
Bloomberg View
,
Credit, Finance, Mortgage, Rates
,
Development, Construction, Architecture & Land
,
Luxury, Super, Ultra, Mega
Bloomberg View Column: Housing’s New Wealth Effect
read more
September 13, 2014
Charts, Maps, Images, Infographics, Video
,
Housing Trends & Cycles
,
Manhattan
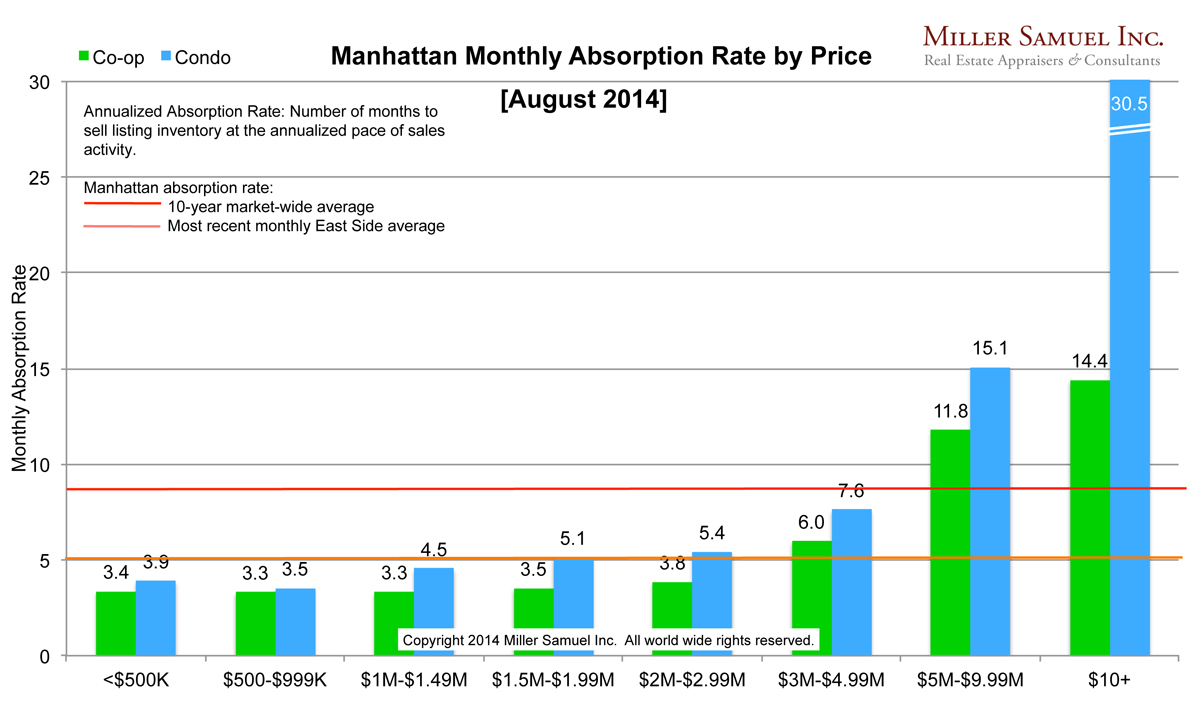
[Manhattan Absorption] August 2014 The $3M-$5M Market Slows Down
read more
June 8, 2014
Charts, Maps, Images, Infographics, Video
,
Development, Construction, Architecture & Land
,
Housing Trends & Cycles
,
Manhattan
[Manhattan Absorption] May 2014 – Swimming in high-end condos.
read more
May 19, 2014
Charts, Maps, Images, Infographics, Video
,
Development, Construction, Architecture & Land
,
Housing Trends & Cycles
,
Manhattan
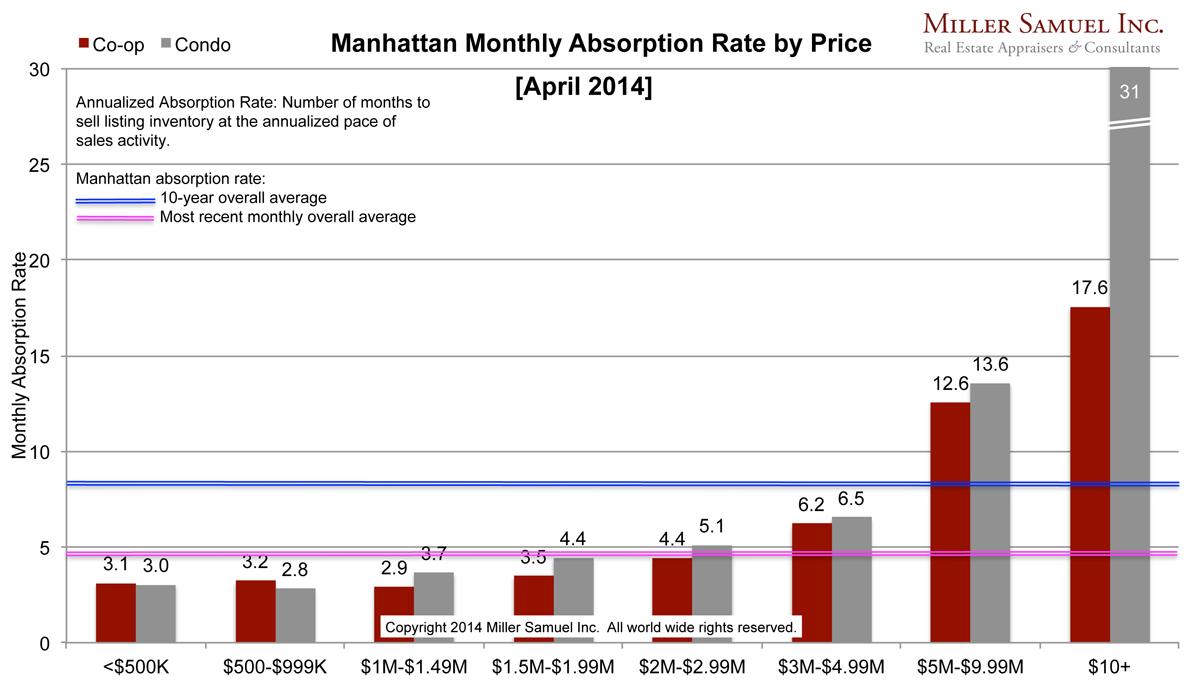
[Manhattan Absorption] April 2014 – Market Pace At Top Eases As Remainder Accelerates
read more
April 12, 2014
Charts, Maps, Images, Infographics, Video
,
Housing Trends & Cycles
,
Manhattan
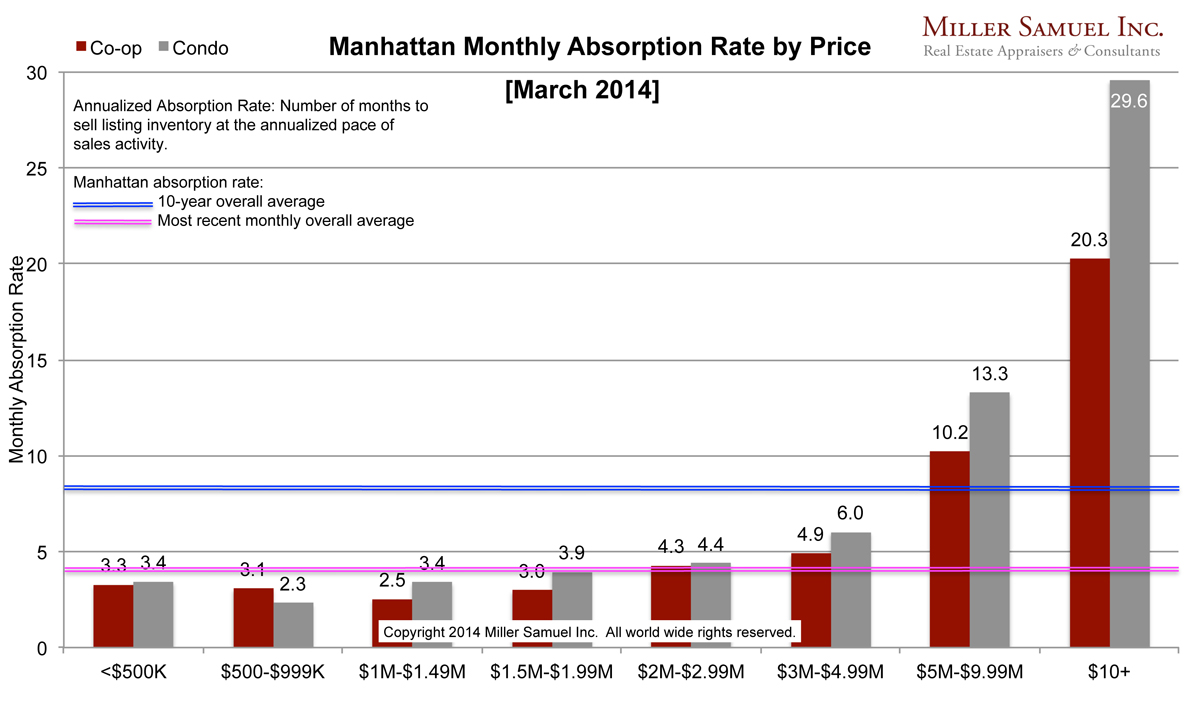
[Manhattan Absorption] March 2014 – All But Top 1% Seeing Faster Pace
read more
March 4, 2014
Analysis & Research
,
Charts, Maps, Images, Infographics, Video
,
Manhattan
[Manhattan Absorption] February 2014 – “Tight Supply” as a Market Rant
read more
March 3, 2014
Charts, Maps, Images, Infographics, Video
,
Manhattan
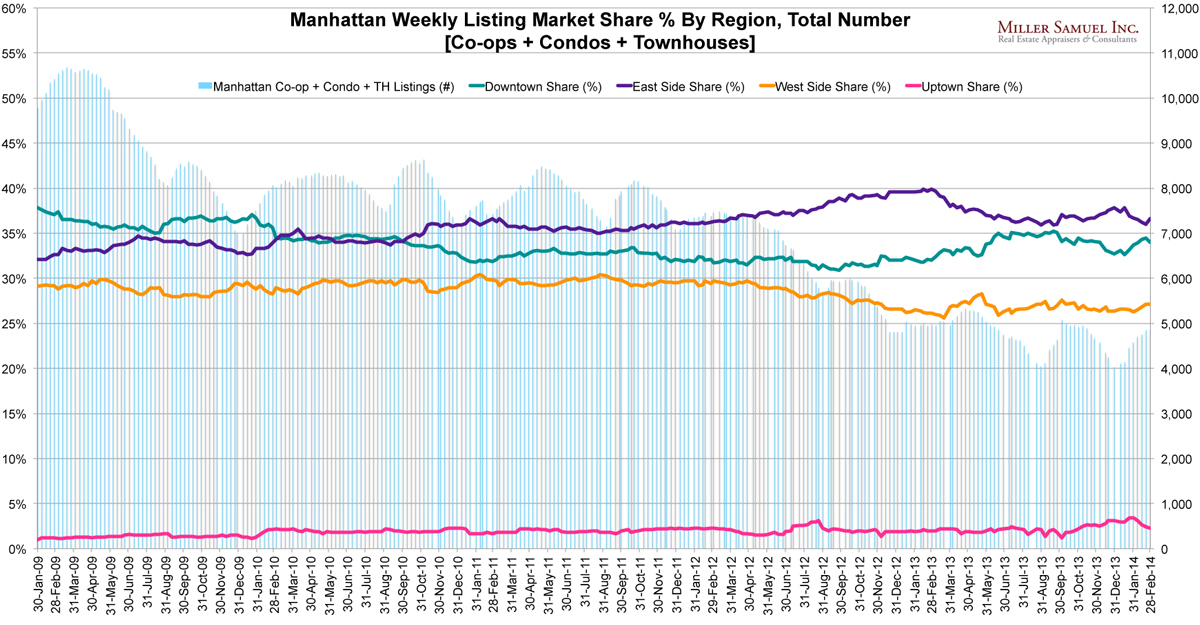
Manhattan’s West Side Inventory Losing More Market Share Than Others
read more
February 5, 2014
Analysis & Research
,
Charts, Maps, Images, Infographics, Video
,
Manhattan
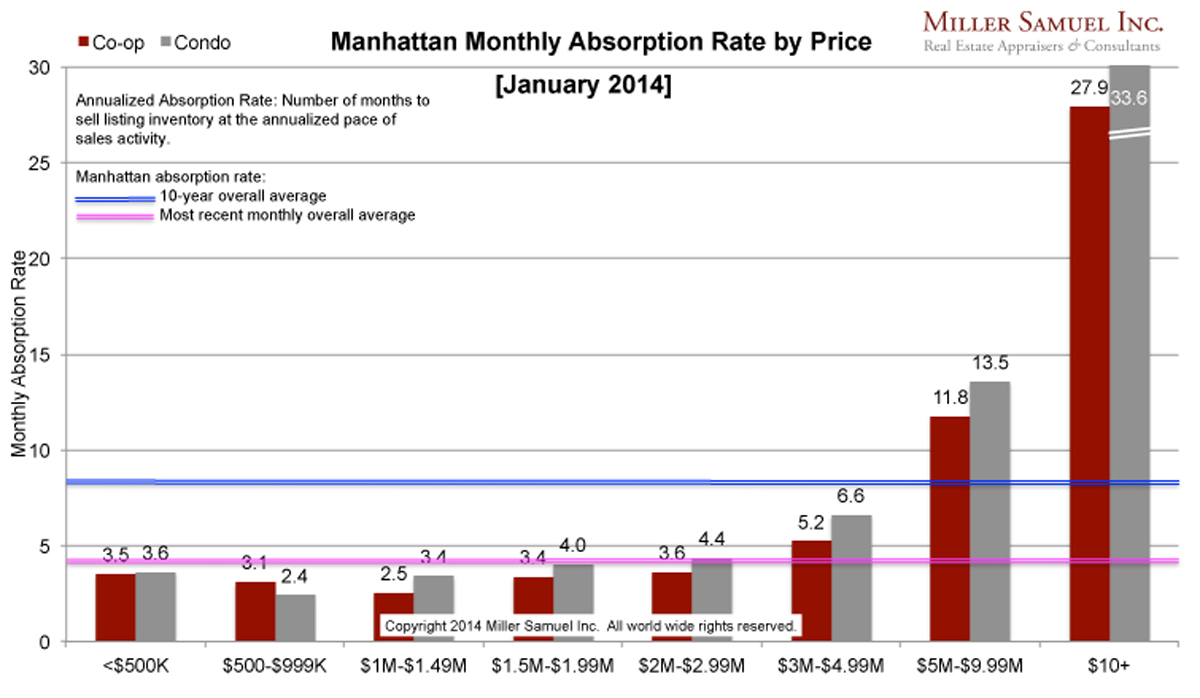
[Manhattan Absorption] January 2014 – “Bottom 99%” of Market Is Tight
read more
February 3, 2014
Curbed
,
List-o-links
,
Manhattan
,
Miami (Beach + Mainland)
Overwhelming Visual Recap of Prior ‘Three Cents Worth’ Columns #250 to #256
read more
1
2
Next
Load More Posts
Page load link
Go to Top