Matrix Blog

Posts Tagged ‘S&P’

Declaring A Housing Recovery Using A Threshold Based on Fraud

November 30, 2016 | 3:16 pm | Charts |

S&P CoreLogic used it’s National Non-Seasonally Adjusted Housing Price Index to declare that the housing market has recovered. Even the ironies of this public relations effort have ironies. I’ll explain.

First, look at this classic Case-Shiller chart. Notice how the arrows don’t connect to the lines they are associated? I’m being petty but it looks like the chart was updated and rushed out the door.

csiclassicchart11-2016

Incidentally, who controls the Case-Shiller Indices brand these days? It used to be “S&P/Case-Shiller Indices.” Here are a couple of variations found in the first paragraph of the press release:

  • S&P Dow Jones Indices
  • S&P CoreLogic Case-Shiller Indices

but I digress

Since the financial crisis, I have spent a good deal of time explaining away the reliability of the Case Shiller Index.

To be clear, I greatly admire Robert Shiller, the Nobel Laureate and his pioneering work in economics. I’ve had the pleasure of speaking with him on a number of occasions both publicly and privately. He and I were on stage together at Lincoln Center back during the housing bubble for a Real Deal event.

During the bubble I was the public face of a short lived Wall Street start-up that collapsed when the bubble burst. Like Case-Shiller it was built to enable the hedging of the housing market to mitigate risk using a different methodology, avoiding the repeat-sales method used in CS. The firm had annoyed Shiller by constantly citing the issues with the CS index and we got far more traction from Wall Street with our index that was (literally) built by rocket scientists. It got to the point where he mentioned me and the startup by name at a conference in frustration.

thhpodcastlogo

After I disconnected with the startup before it imploded, I reached out and we made up. In fact he did my Housing Helix podcast (link broken but hope to bring it back online soon for historical reference) at my office back when I was doing a podcast series of interviews with key people in housing). Also we’ve run into each other on the street in Manhattan a number of times. In fact when he learned of my love of sea kayaking he gave me the latitude and longitude coordinates of his island vacation home in case I was nearby. You can see that I feel a little guilty criticizing the use of the index since he is one of the nicest and smartest people I’ve ever had the honor to meet.

But I don’t like the way S&P, Dow Jones and/or CoreLogic have positioned Case-Shiller as a consumer benchmark. And especially yesterday’s announcement as a marker for the recovery of the U.S. housing market. I feel this is a low brow attempt by these institutions to leverage publicity without much thought applied to what is actually being said. Here are some thoughts on why it is inappropriate to use this moment as a marker for the housing recovery.

“The new peak set by the S&P Case-Shiller CoreLogic National Index will be seen as marking a shift from the housing recovery to the hoped-for start of a new advance” says David M. Blitzer, Managing Director and Chairman of the Index Committee at S&P Dow Jones Indices.

Blitzer remains in the very awkward position of explain away the gap between the market 6 months ago and current condition as if there is no difference. He does this by using anecdotal commentary about metrics like supply that has nothing to do with the price index as well as making pithy remarks.

  • The Case-Shiller National Index is being touted for reaching the record set in the housing bubble a decade ago despite the record being set back then by artificial aka systemic mortgage fraud. However their 20 city index has been pushed as the key housing benchmark for more than a decade, not the national index. And they are using the non-seasonally adjusted national index to proclaim the record beaten despite their long time preference of presenting seasonally adjusted indices (the seasonally adjusted national index has not broken the housing bubble record yet).

  • The credit bubble got us to the 2006 peak, not anything fundamental.

cshpitablefrompeak11-2016

  • In my thirty years of valuation experience, I have learned that sales transactions, not prices, should be the benchmark for a housing market’s health.

  • The 0% markets that reached the 2006 peak are super frothy – created by rapidly expanding economies and an inelastic housing supply. Income growth doesn’t always justify their price growth. Click on table below for the markets shaded in turquoise.

csnsazero

Some important background points on the Case Shiller Home Price Index (CS) – that most of its users are unaware of:

  • CS was never intended for consumer use! It was built for Wall Street to trade derivatives to hedge housing market risk much like hedging risk for weather, insurance, non-fat dry milk and cheddar cheese.

  • CS never caught on because housing is a slow and lumbering asset class, unlike a stock which has much more liquidity. The flaw during this bubble period was the way Wall Street and most real estate market participants considered housing as liquid as a stock and how financial engineering had enabled that liquidity.

  • As access to public housing data has become more ubiquitous, the index has been more easily gamed by companies like Zillow, who have been able to accurately predict the index results much sooner rendering the index as useless for hedging.

  • CS lags the actual “meeting of the minds” between by buyers and sellers – when they agree on the price and general terms – by 5-7 months. The November report just released was based on the 3 month moving average of closed sales from July, August and September. If we say that contract to close period is an average of 60 days, then the contracts signed in this batch of data represent May, June and July. And the time between the “meeting of the minds” and the signed contracts can be a couple of weeks, so the results in yesterday’s lease of the Case-Shiller index represents the period around Memorial Day weekend as summer was getting started.

  • CS only represents single family homes (although they have an index for condos).

  • CS excludes new development.

  • There is little if any seasonality in the CS methodology (even though there is a seasonally adjusted version).

  • Geographic areas in the 10 and 20 city CS indices are incredibly broad. For example, the “New York” index includes New York City, Long Island, Hamptons, Fairfield County, Westchester County, a bunch of counties in northern NJ and a county in Pennsylvania. Yet this index is often represented as a proxy for the Manhattan housing market by national news outlets. Manhattan residential sales have about a 1% market share of single family homes.

In other words, the CS index is a great academic tool to trend single family home prices at a 30,000 foot view for research but not to measure the current state of your local market.

Tags: , , , , ,


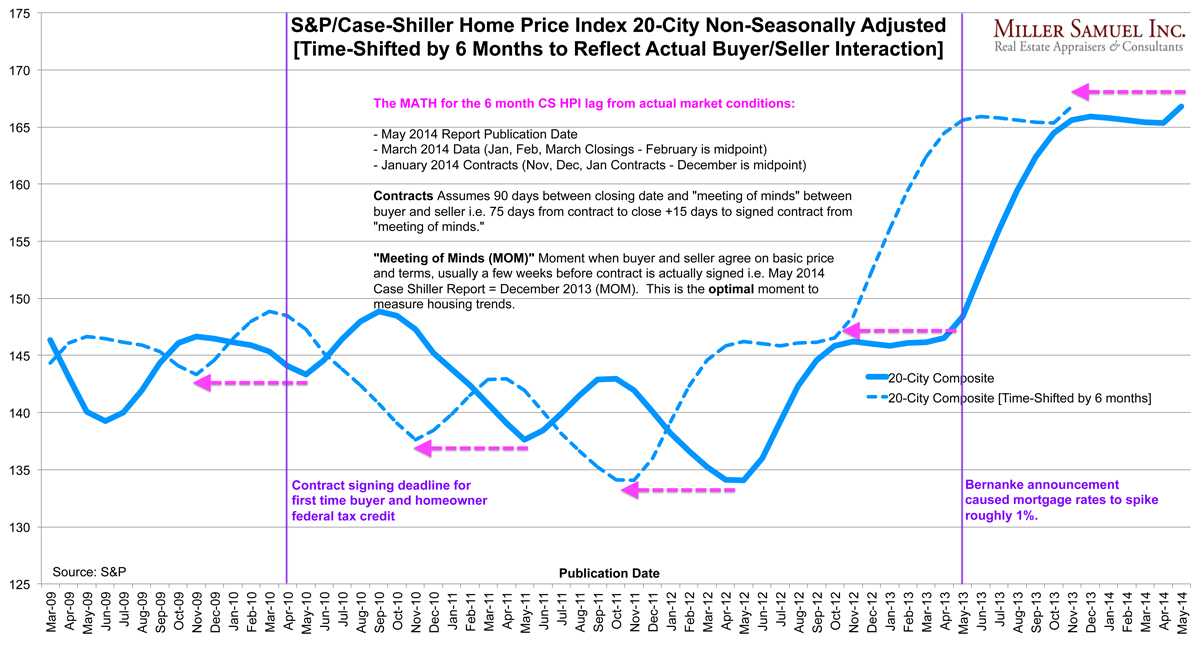
Pulling the Case-Shiller Index Back by 6 Months to Reflect Actual Buyer/Seller Behavior

May 27, 2014 | 10:45 pm | Charts |

matrixCSIshift-5-27-14
[click to expand]

The Case Shiller Index was released today and it continued to confuse consumers, pundits, economists etc…and for good reason. It’s 6 months late.

I wondered what would happen if their index result was pulled back by 6 months to see how it lined up with a couple of significant housing milestones (purple vertical lines). The most recent housing milestone was last year’s Bernanke speech that resulted in the spike in mortgage rates in May-June of 2013.

In the modified trend line (dotted blue) housing prices surge up until mortgage rates spike. This is clearly more logical than the actual index showing housing prices surging for six months after the mortgage rate spike.

In the earlier milestone in April 2010, the adjusted index (dotted blue line) immediately begins to slide after the April 2010 signed contract deadline passed to qualify for the federal homeowner tax credit as part of the stimulus plan. Yes, that’s exactly what happened on the front lines.

I’m going to call this new methodology “time-shifting a housing index.” From an historical perspective, this is a much more useful and reliable trend line. For the near term, it places the CS HP 6 months behind the market without any relevance to current conditions. Then again, the S&P/Case Shiller Home Price Index was never meant to be a monthly housing indicator for consumers as it is currently used by the media. It was originally created to enable Wall Street to hedge housing but never caught on because of the long time lag and therefore the eventual ability of investors to accurately predict the results.


The top chart is fairly self-explanatory but here’s the math again:

  • May 2014 Report Publication Date
  • March 2014 Data (Jan, Feb, March Closings – February is midpoint)
  • January 2014 Contracts (Nov, Dec, Jan Contracts – December is midpoint)

Contracts Assumes 90 days between closing date and “meeting of minds” between buyer and seller i.e. 75 days from contract to close +15 days to signed contract from “meeting of minds.”

“Meeting of Minds” Moment when buyer and seller agree on basic price and terms, usually a few weeks before contract is actually signed i.e. May 2014 Case Shiller Report = December 2013. The optimal moment to measure housing.

Here’s a regular chart that has a longer timeline, with and without seasonal adjustments (you can see that seasonal adjustments are essentially meaningless.)

matrixCSI-5-27-14

Tags: , , ,


Talking Heads: Burning Down The House, S&P Style

February 5, 2013 | 4:48 pm | |

As the credit world was unraveling around them, email communications between analysts at S&P seems to be pretty damming to their neutrality position. And finally now the lawsuit. There’s a fascinating re-write of the great Talking Heads song “Burning Down The House” by an S&P analyst.

I’ve got the entire Talking Heads catalogue on my iPhone and I’ll bet that David Byrne and the rest of the ‘Heads never imagined their music would used to describe a global credit bubble.

Here is the S&P email with the revised lyrics – as the credit world was imploding…

“With apologies to David Byrne…here’s my version of “Burning Down the House”

“Watch out
Housing market went softer
Cooling down
Strong market is now much weaker
Subprime is boi-ling o-ver
Bringing down the house

Hold tight
CDO biz — has a bother
Hold tight
Leveraged CDOs they were after
Going — all the way down, with
Subprime mortgages

Own it
Hey you need a downgrade now
Free-mont
Huge delinquencies hit it now
Two-thousand-and-six-vintage
Bringing down the house.”

Wow. Their other songs like “Wild Wild Life”, “Road to Nowhere”, and “Psycho Killer” might have also done the trick.

Tags: , ,


S&P: Housing Appreciation Will Ease Gradually, Modestly, Step-By-Step, Bit-By-Bit and Slowly

September 19, 2005 | 10:18 pm | |

There was another prominent article this week on the housing market. Like the previous post covering today’s [article in the Wall Street Journal](http://matrix.millersamuel.com/?p=133), S&P released a study of the US Housing market that suggests that prices will decelerate and stabilize. A crash is not likely.

The bubble should end with a fizzle, not a bang, said S&P Chief Economist David Wyss

The average US home price is a record 3.1 times the average household income up from 2.6 times in 1960. Home ownership is 69.4%, also a record.

Most price appreciation is located in California, northeast and Florida. S&P estimates that it would take a 30% decline in national home prices to start even a modest recession, although they think that this is unlikely.

Tags: ,

Get Weekly Insights and Research

Housing Notes by Jonathan Miller

Receive Jonathan Miller's 'Housing Notes' and get regular market insights, the market report series for Douglas Elliman Real Estate as well as interviews, columns, blog posts and other content.

Follow Jonathan on Twitter

#Housing analyst, #realestate, #appraiser, podcaster/blogger, non-economist, Miller Samuel CEO, family man, maker of snow and lobster fisherman (order varies)
NYC CT Hamptons DC Miami LA Aspen
millersamuel.com/housing-notes
Joined October 2007