Matrix Blog

Posts Tagged ‘Inventory’

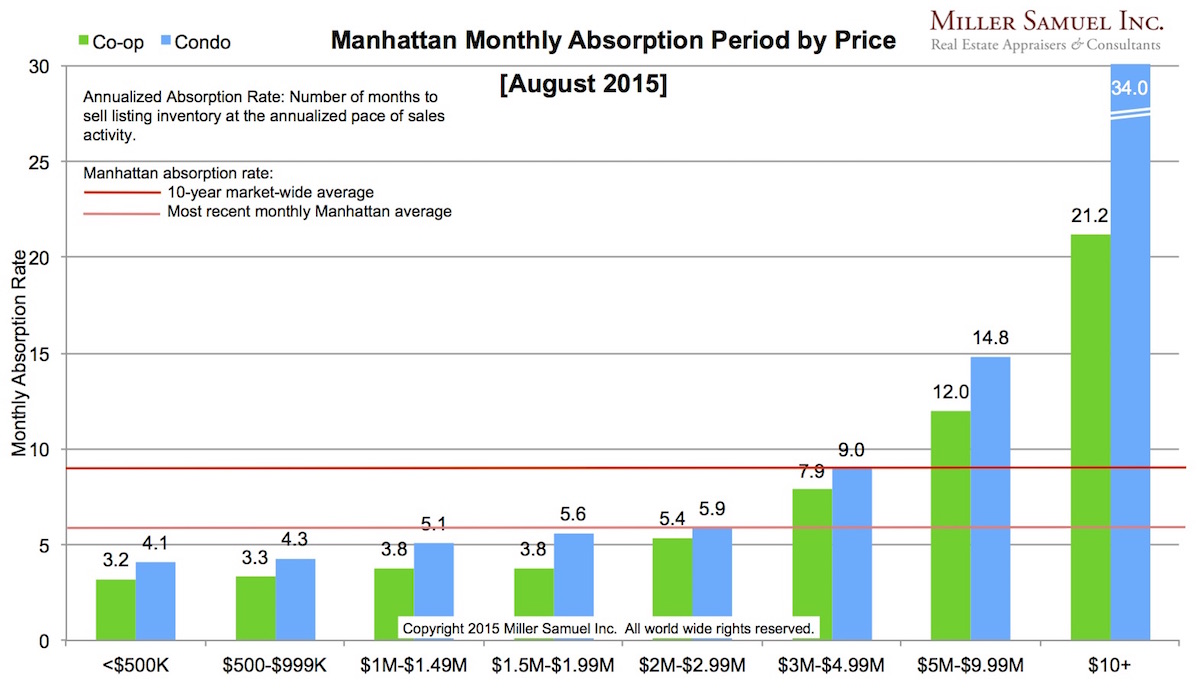
Manhattan Monthly Absorption Rate – August 2015

September 22, 2015 | 2:07 pm | Charts |

8-2015Manhattan [click to expand]

Thoughts The co-op and condo market absorption rates for the $10 million+ market have slowed over the past year while the pace of the sub-$3 million remains extremely brisk. The $3 million to $10 million shows limited change and some stabilization.

Side by side Manhattan regional comparison:

August 2015 v August 2014
8-20158-2014 [click images to expand]

I started this analysis in August 2009 so I am able to show side-by side year-over-year comparisons. (I got tired of the red/gray look in 2014 so I changed it) The blue/red line shows the 10-year quarterly average for context. The pink/orange line represents the overall average absorption rate of the most recently completed month for that market area.

Definition Absorption defined for the purposes of this chart is: Number of months to sell all listing inventory at the current annualized pace of sales activity in our market report series.


Manhattan Market Absorption Charts [Miller Samuel]

Tags: , ,


Bloomberg View Column: Housing’s New Wealth Effect

September 27, 2014 | 1:00 pm | | Charts |

BVlogo

Read my latest Bloomberg View column Housing’s New Wealth Effect. Please join the conversation over at Bloomberg View. Here’s an excerpt…

It was a busy week for housing market reports. The U.S. Census published its new home-sales results for August, showing an 18 percent gain from the prior month and a 33 percent increase from August 2013. News headlines relied on words such as “surged” and “soared” to describe the results.

Only a few days earlier, the National Association of Realtors released its existing home-sales report for August, which showed month-over-month sales falling for the first time in four months. The inventory of unsold properties was 4.5 percent higher than a year earlier. I recently addressed the market slowdown in “Understanding Housing’s Dog Days.”

[read more]


My Bloomberg View Column Directory

My Bloomberg View RSS feed.

Tags: , , , , , , ,


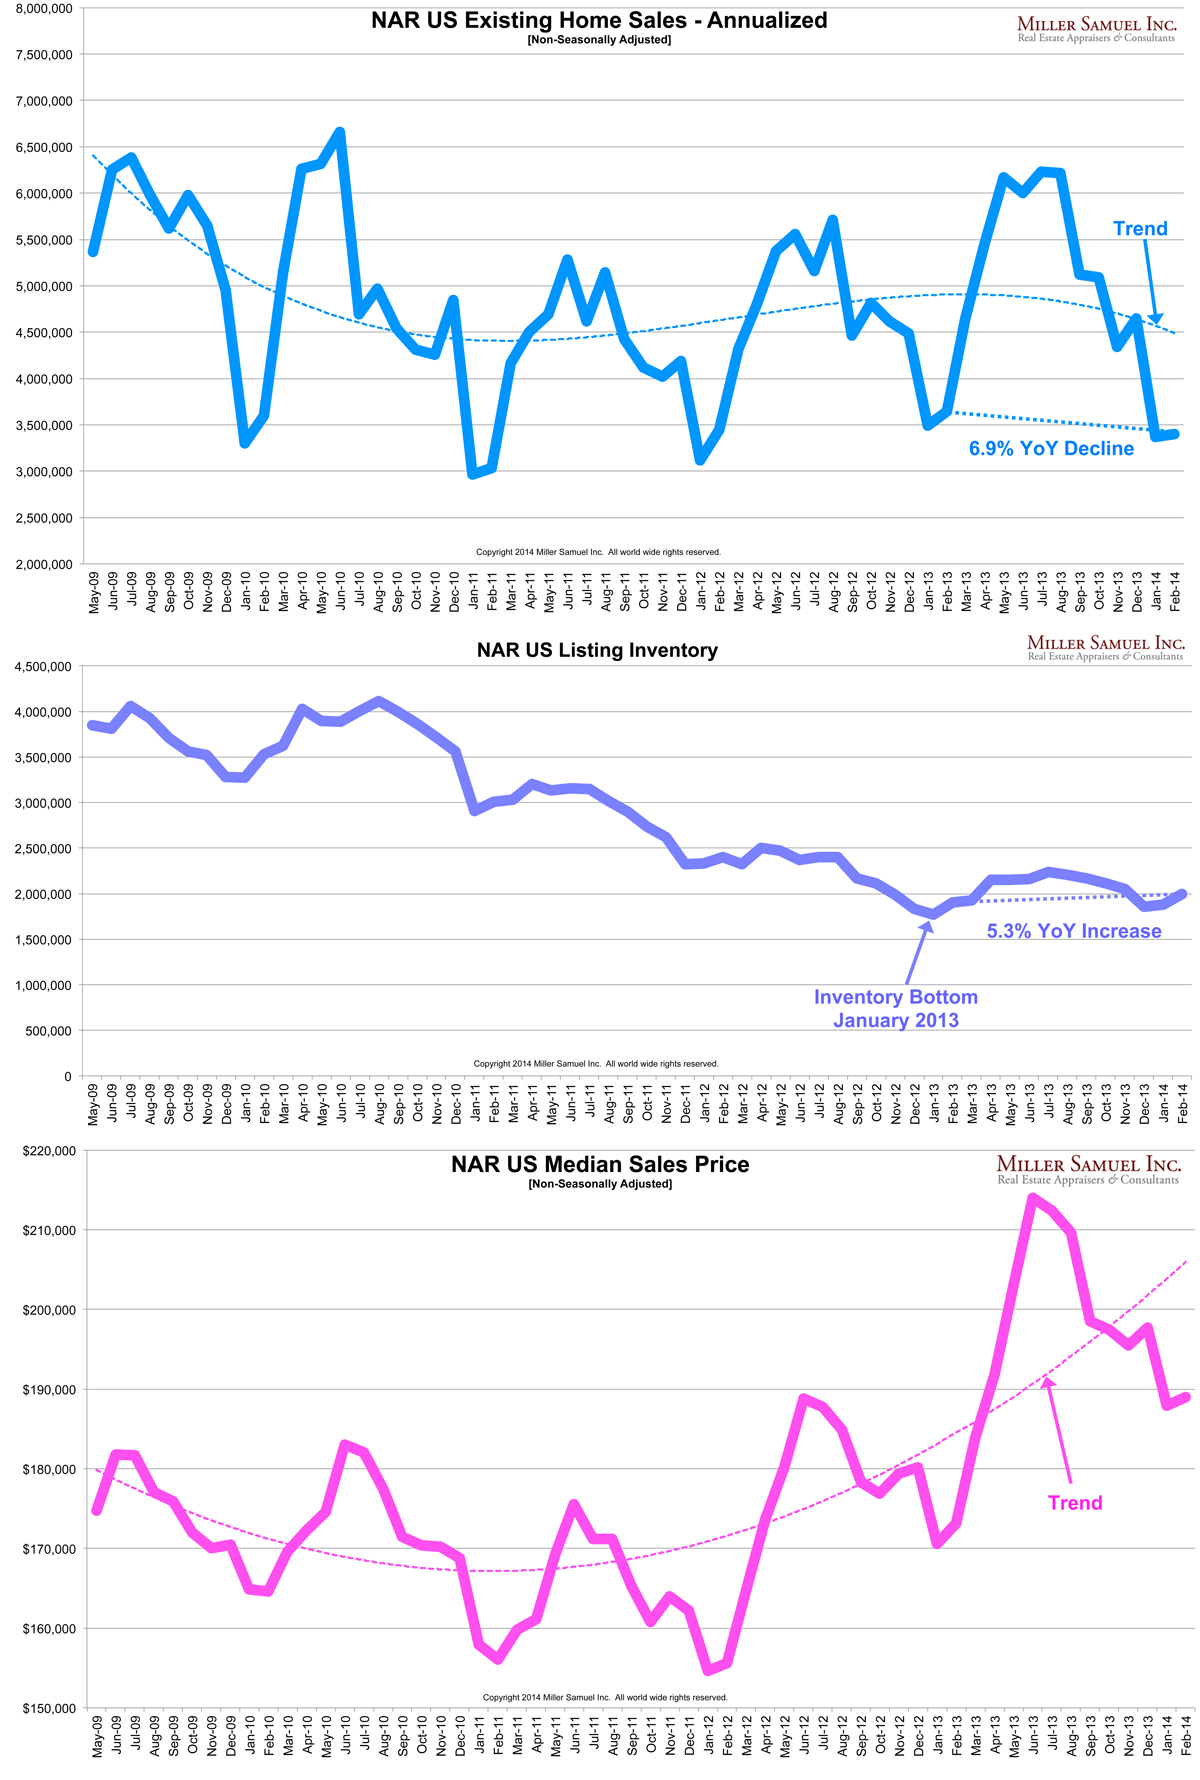
NAR Existing Home Sales Blink, And So What?

March 23, 2014 | 9:00 am |

NAR released their Existing Home Sales Report on Thursday with a headline that read: February Existing-Home Sales Remain Subdued that blamed the severe winter weather and low inventory for lower sales.

Of course inventory has been near historic lows for a few years so that’s not a new reason. I’m left with the weather and as someone who hates to use the weather as a crutch, it seems to be a pragmatic – it’s difficult to show or be in the mood to view properties when it is zero degrees outside. The weather explanation was also used in the prior report but those contracts were signed in December for the January report, before the “polar vortex.”

However the recent hand ringing caused by the downshift in sales is the concern that the recovery is cooling off.

I see the recent fretting about the cooling of housing as an indication of how improving conditions were based largely on Fed policy and not fundamentals. The combination of rising mortgage rates and declines from the year ago release of pent-up demand post-“fiscal cliff” likely gets price gains and sales levels in sync with fundamental economic conditions.

I’ve charted NAR EHS stats from the past 4 years without seasonal adjustments. Price gains have been insane so the combination of slowing sales and rising inventory will take the froth out of the market and hopefully get us on a more sustainable path.

2-14NARehs

Tags: , , , , , , ,


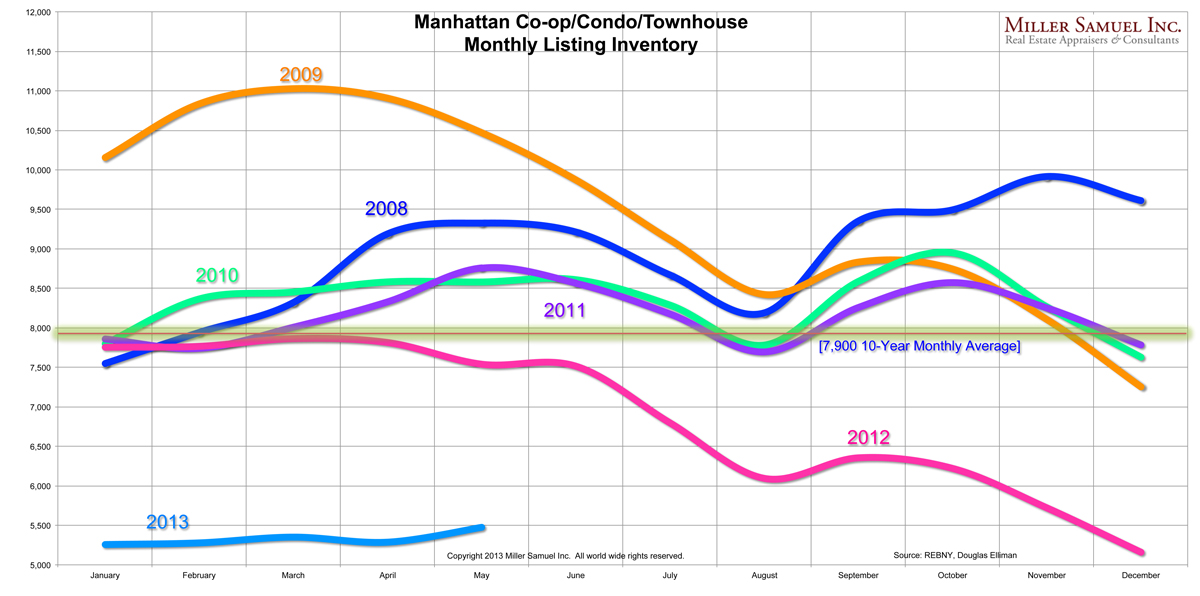
Manhattan Inventory Trend Remains Flat as a Pancake in 2013

June 5, 2013 | 12:27 pm | Charts |


[click to expand]

There has been remarkably little YTD improvement of available co-op/condo supply in Manhattan. This chart reflects co-op, condo and townhouse supply (existing + new dev).

While we are now seeing a little more inventory enter the market, sales are outpacing prior year levels erasing any meaningful gains in supply. This chart illustrates how flat supply has remained in 2013.

Tags:


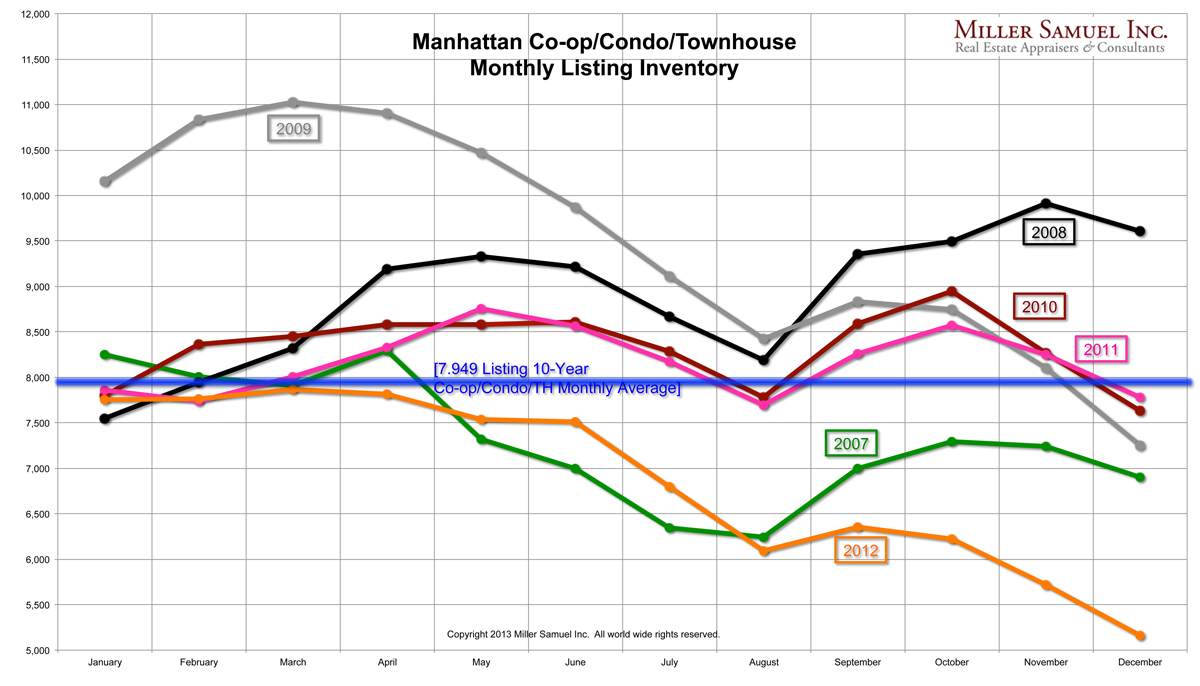
Manhattan Listings Fall off “The Cliff”

January 3, 2013 | 11:28 am | Charts |


Sorry but I just had to have at least one blog post title with “cliff” in it. But seriously, the 2012 drop in listing inventory was quite pronounced in the context of recent years and it is at it’s lowest level since 2000 when I began tracking it.

This is the same situation on a national level.

Tags:

Get Weekly Insights and Research

Receive Jonathan Miller's 'Housing Notes' and get regular market insights, the market report series for Douglas Elliman Real Estate as well as interviews, columns, blog posts and other content.

Follow Jonathan on Twitter

#Housing analyst, #realestate, #appraiser, podcaster/blogger, non-economist, Miller Samuel CEO, family man, maker of snow and lobster fisherman (order varies)
NYC CT Hamptons DC Miami LA Aspen
millersamuel.com/housing-notes
Joined October 2007