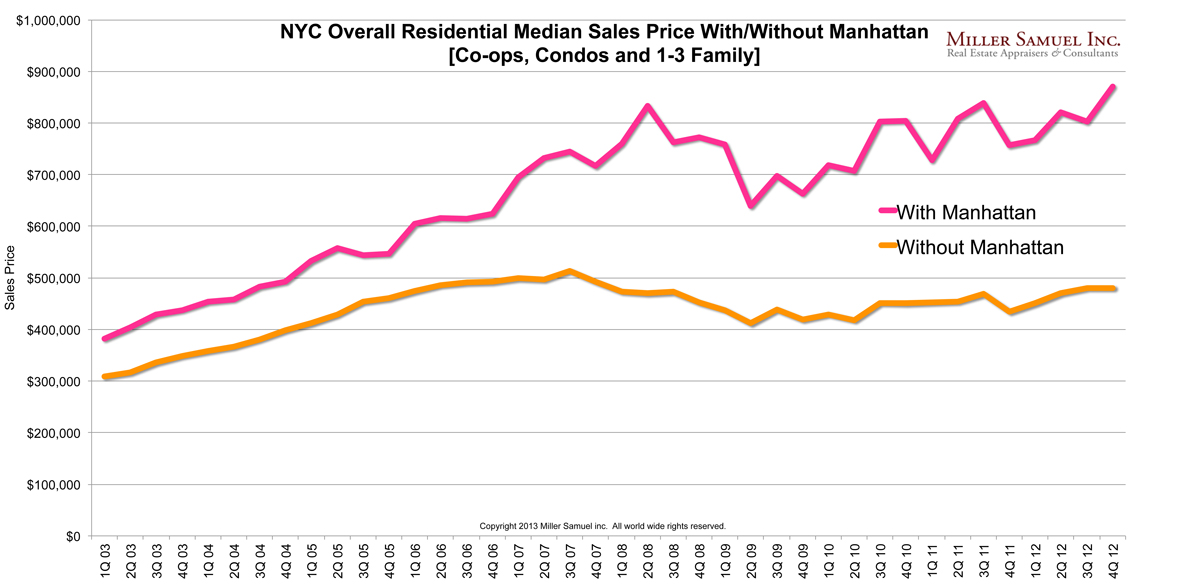
As the above chart illustrates, the aggregate median housing price in New York City, based on co-op, condo and 1-3 family property sales, with and without Manhattan sales go their separate ways circa mid-2006, at the Case-Shiller Home Price Index peak of the national housing market. This also makes the decline in the New York Case Shiller HPI all that more maddening (because it’s not Manhattan, or co-ops or condos or new development and includes Long Island, Fairfield, Westchester, Northern New Jersey and a county in Pennsylvania).
The market share for new development sales in Manhattan peaked in 2Q 06 at 57.9%. The 4Q12 market share was 12.5% but fear not, more new development is coming per The Real Deal.
During the boom through today, the shift in the mix towards Manhattan luxury property, largely from the combination of new development activity as well as vigorous Wall Street and international demand has expanded the difference between Manhattan and the rest of New York City. In other words, the gain in median sales price for NYC was caused by a shift in the mix toward higher end properties.
One Comment
Comments are closed.


It’s amazing to see how much the Manhattan housing market affects the rest of the country. Interesting observation!