Matrix Blog

Hamptons/North Fork

[Three Cents Worth Hamptons #242] Now About That $5M+ Hamptons Market…

August 14, 2013 | 3:05 pm | | Charts |

It’s time to share my Three Cents Worth (3CW) on Curbed Hamptons, at the intersection of sand dunes and real estate in the East End of Long Island, NY.

Check out my 3CW column on @CurbedHamptons:

This week, I thought I’d show how the other half (the top 4.9%) live—well, actually, how they react to large external events like economic collapse and repeated fiscal cliff drama. We seem to be having these significant events on a 2-year cycle now, at least for the past 6 years. The end of the year seems to be where a lot of the drama occurs..

[click to expand chart]


My latest Three Cents Worth column on Curbed: Now About That $5M+ Hamptons Market… [Curbed]

Three Cents Worth Archive Curbed NY
Three Cents Worth Archive Curbed DC
Three Cents Worth Archive Curbed Miami
Three Cents Worth Archive Curbed Hamptons

Tags: , ,


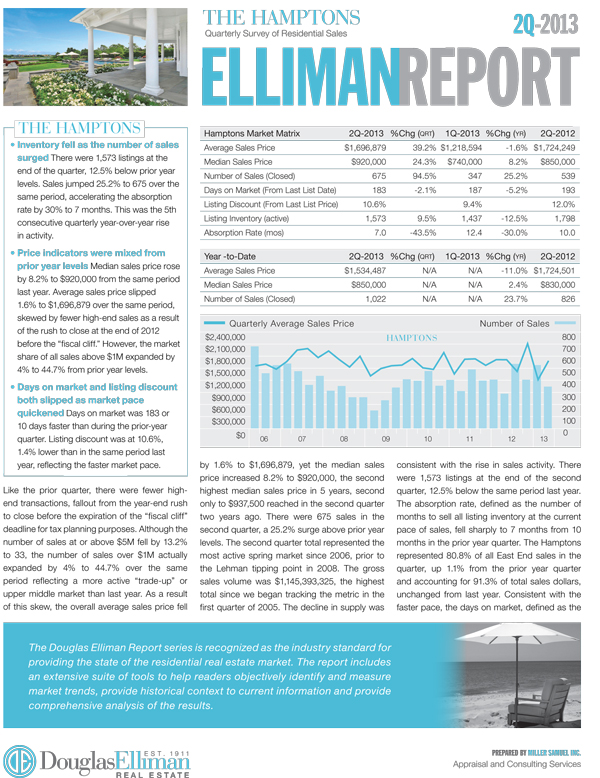
[Sales Surged] 2Q 2013 Hamptons Sales Report

July 26, 2013 | 11:05 am | | Reports |

Douglas Elliman published the market report we prepared on the Hamptons sales market for 2Q 2013.

This is part of an evolving market report series I’ve been writing for Douglas Elliman since 1994.

Key Points

  • Highest number of second quarter sales since 2006.
  • Listing inventory continued to fall.
  • Second highest median sales price in 5 years.
  • Sales above $5M slipped, but overall gain in sales above $1M expanded.
  • Despite jump in sales, would likely have been more without 2012 year end “fiscal cliff” rush.

Here’s an excerpt from the 2Q 2013 report:

…Like the prior quarter, there were fewer highend transactions, fallout from the year-end rush to close before the expiration of the “fiscal cliff” deadline for tax planning purposes. Although the number of sales at or above $5M fell by 13.2% to 33, the number of sales over $1M actually expanded by 4% to 44.7% over the same period reflecting a more active “trade-up” or upper middle market than last year. As a result of this skew, the overall average sales price fell by 1.6% to $1,696,879, yet the median sales price increased 8.2% to $920,000, the second highest median sales price in 5 years, second only to $937,500 reached in the second quarter two years ago…

You can build your own custom data tables on the market – now updated with 2Q 13 data. Check out the charts by browsing in our chart library.


The Elliman Report: 2Q 2013 Hamptons Sales [Miller Samuel]
The Elliman Report: 2Q 2013 Hamptons Sales [Douglas Elliman]
Market Chart Library [Miller Samuel]
Aggregated Custom Market Data Tables [Miller Samuel]


[Prices Up] 2Q 2013 North Fork Sales Report

July 26, 2013 | 10:53 am | | Reports |

Douglas Elliman published the report we author on the North Fork sales market for 2Q 2013.

This is part of an evolving market report series I’ve been writing for Douglas Elliman since 1994.

Key Points

  • Housing prices were up across all segments.
  • Inventory fell from year ago levels as marketing time dropped.
  • Number of sales up sharply.
  • Credit remained tight keeping inventory low.

Here’s an excerpt from the 2Q 2013 report:

…In the second quarter of 2013, the North Fork housing market was characterized by rising sales and prices along with falling inventory. Many buyers have entered the market due to the combination of the following factors: tight credit, low inventory, the release of pent-up demand after the last year’s market uncertainty caused by the fiscal cliff, and anticipated rise of mortgage rates, due to the improved economy. Both price indicators were higher than the prior year levels. Median sales price was $459,750, up 10.8% and the average sales price rose 4% to $679,720…

You can build your own custom data tables on the market – now updated with 2Q 13 data. Check out the charts by browsing in our chart library.


The Elliman Report: 2Q 2013 North Fork Sales [Miller Samuel]
The Elliman Report: 2Q 2013 North Fork Sales [Douglas Elliman]
Market Chart Library [Miller Samuel]
Aggregated Custom Market Data Tables [Miller Samuel]


[No Fiscal Cliff Hangover] 1Q 2013 Hamptons & North Fork Reports

May 13, 2013 | 10:02 am | | Reports |

[click to open reports]

We recently released the market reports we prepare for Douglas Elliman covering the The Hamptons and North Fork.

This is part of an evolving market report series I’ve been writing for Douglas Elliman since 1994.

Key Points

HAMPTONS 1Q 2013

  • Listing inventory continued to fall.
  • Number of sales surged.
  • Number of sales in excess of $5M dropped as many high end buyers rushed to close at the end of 2012.
  • Limited supply beginning to apply upward pressure to stable markets.
  • Credit remains tight, restraining supply from entering market, no urgency to list.
  • Record low mortgage rates and release of pent-up demand keeping demand strong.
  • Less high end sales as tax-incentivized buyers rushed to close at the end of 2012.

NORTH FORK 1Q 2013

  • Housing prices up in all segments except for top quintile due to tax-incentivized rush at end of 2012.
  • Number of sales fell and listings rose.
  • Days on market expanded.


Here’s an excerpt from the 1Q 2013 report:

HAMPTONS…After an unprecedented year end surge in high end closings motivated by tax planning purposes, the first quarter Hamptons housing market saw an unusually low level of high end sales despite a year-over-year increase in total sales. As a result, the price indicators reflected declines, when in fact the housing market was not experiencing falling prices…

NORTH FORK…Sales activity in the first quarter of the North Fork housing market was somewhat weaker than the same period a year ago as the prior quarter “poached” some activity at the close of 2012. Price indicators were generally higher, but sales were lower and inventory was above prior year levels…

You can build your own custom data tables on the market – now updated with 1Q 13. While we haven’t built separate chart galleries for each market yet, you can browse our chart library.


The Elliman Report: 1Q 2013 Hamptons Sales [Miller Samuel]
The Elliman Report: 1Q 2013 North Fork Sales [Miller Samuel]
The Elliman Report: 1Q 2013 Hamptons Sales [Douglas Elliman]
The Elliman Report: 1Q 2013 North Fork Sales [Douglas Elliman]
Market Chart Library [Miller Samuel]
Aggregated Custom Market Data Tables [Miller Samuel]


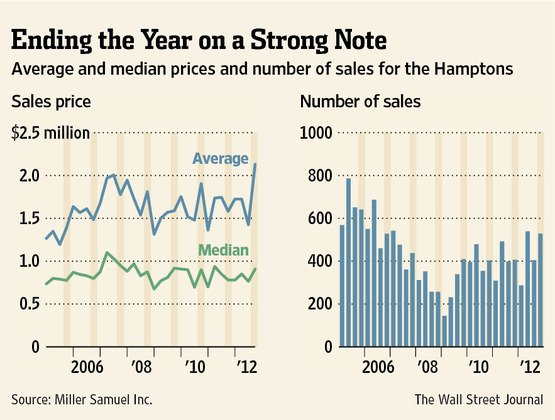
Hampton Year End Sales And Price Spike, Fiscal Cliff Style

January 29, 2013 | 1:03 pm | | Charts |


[click to read article (subscr)]

I thought the chart created by the WSJ using our data nicely illustrated the end of year spike in sales and prices at the end of the 2012, influenced by the notion that taxes, whatever form they take, will be higher in the future. I think this surge in activity will take some of the edge off the market in 2013.

Tags: ,


Video: Record Average Sales Price In Hamptons

January 27, 2013 | 3:21 pm | | TV, Videos |

The record average sales price in our Douglas Elliman Hamptons market report made “The Bloomberg Number” today on Betty Liu’s show “In The Loop.”

The record price (highest we’ve seen since we began tracking it in 1999) was the result of skew towards the high end of the market as higher end consumers pushed to close prior to December 31 to avoid potential tax increases. It’s not that housing prices are rising, rather a lot more sales closed at the high end in 4Q12. For example there were more sales to close at or above $5M (49) than we have seen since we began tracking this metric in mid-2008.

Looks for a slower market in 1Q13 as sales that would have organically closed were poached (pulled back) into 4Q12.


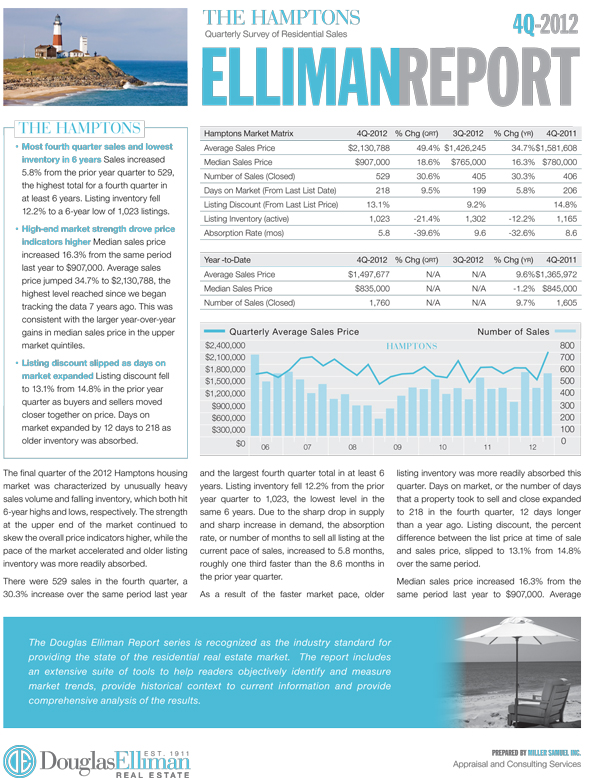
[Tax Planning on Steroids] 4Q 2012 + 2003-2012 Hamptons/North Fork Decade Reports

January 25, 2013 | 12:08 pm | | Reports |

[click to open reports]

We published our 4Q 2012 reports for both The Hamptons and North Fork. Since this was the final quarter of 2012, we also released our Hamptons/North Fork Decade report, a ten year moving window data compendium of the Hamptons/North Fork market from 2003-2012

This is part of an evolving market report series I’ve been writing for Douglas Elliman since 1994.

Key Points

HAMPTONS 4Q 2012

  • Most fourth quarter sales and lowest level of inventory in 6 years.
  • Highest average sales price in 7 years, skewed by high end market strength.
  • Days on market expanded as older listings were absorbed due to lack of supply.
  • Credit remains tight as economy slowly improves.
  • Inventory falling – low to negative equity, no urgency to list.
  • Sales rising as record low mortgage rates create demand.
  • A release in pent-up demand from election year and “fiscal cliff” concerns over rising taxes.over rising taxes.

NORTH FORK 4Q 2012

  • Inventory at lowest level in four years.
  • Sales rising from record low mortgage rates and pent-up demand.
  • Credit remains tight as economy slowly improves.
  • Inventory falling – low to negative equity, no urgency to list.

HAMPTONS/NORTH FORK 2003-2012

  • Median sales price up 31.9% over decade.
  • Average sales price nearly doubled, reflecting emphasis on luxury market over the decade.
  • Number of sales 20.4% less than in 2003.
  • Days on market 2 months slower than in 2003.


Here’s an excerpt from the 4Q 2012 report:

HAMPTONS…The final quarter of the 2012 Hamptons housing market was characterized by unusually heavy sales volume and falling inventory, which both hit 6-year highs and lows, respectively. The strength at the upper end of the market continued to skew the overall price indicators higher, while the pace of the market accelerated and older listing inventory was more readily absorbed…

NORTH FORK…The fourth quarter 2012 North Fork housing market was marked by upward price pressure, falling inventory, rising sales and a faster pace than we had seen in the same quarter a year ago. The price gains were weighted towards the end of 2012, as falling inventory provided buyers with fewer options and record low mortgage rates fostered additional affordability…

You can build your own custom data tables on the market – now updated with 4Q 12 and annual 2003-2012 data. I’ll post the updated charts soon. In the meantime you can browse our chart library.


The Elliman Report: 4Q 2012 Hamptons Sales [Miller Samuel]
he Elliman Report: 4Q 2012 North Fork Sales [Miller Samuel]
The Elliman Report: 2003-2012 Hamptons/North Fork Decade [Miller Samuel]
The Elliman Report: 4Q 2012 Hamptons Sales [Douglas Elliman]
The Elliman Report: 4Q 2012 North Fork Sales [Douglas Elliman]
The Elliman Report: 2003-2012 Hamptons/North Fork Decade [Douglas Elliman]
Market Chart Library [Miller Samuel]
Aggregated Custom Market Data Tables [Miller Samuel]


Hamptons High End Market in 4Q: Hedging Against Possible Rise in Capital Gains?

November 6, 2012 | 8:00 am | | Charts |


[click to expand]

This chart is an enlarged version of a chart that appeared within our just released Elliman Report: Hamptons/North Fork Sales. I’ve expanded it because I was struck by the randomness of activity in the $5M and up sector of the market (blue columns). Clearly the pattern follows the market stall after Lehman’s ’08 bankruptcy for a few quarters but otherwise, the sales don’t seem to follow a pattern, seasonal or otherwise.

The two quarters with a spike of 38 sales, 4Q 2010 and 2Q 2012 could be explained perhaps but the reasons aren’t that compelling in comparison to how much they stand out.

4Q 2010 The looming Bush tax cut expiration at the end of 2010 caused many sellers to bring high end properties and they were quickly absorbed.

2Q 2012 The prior quarter seemed to be an elevated spring surge.

4Q 2012 Will the 4th quarter see the same phenomenon as 4Q 2010? The capital gains implications are the same – will the Bush tax cuts be extended? – I’m not sure but our appraisal practice is inundated with valuation assignments of high end properties hedging against the potential end of year rise in capital gains tax.

The aftermath of Hurricane Sandy and the imminent Snor’eastercane may change the 4Q 2012 results.

Tags: ,


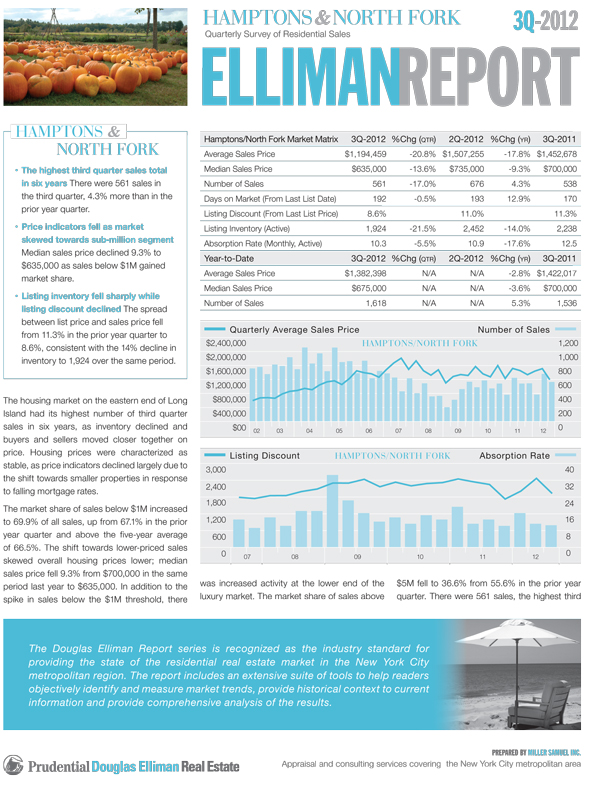
[6 Year High] 3Q 2012 Hamptons & North Fork Report

October 25, 2012 | 2:54 pm | | Reports |

We published our report on the Hamptons & North Fork sales market for 3Q 2012.   This is part of an evolving market report series I’ve been writing for Douglas Elliman since 1994.

Key Points

Hamptons & North Fork

-Sales increased to highest 3rd quarter total in 7 years.
-Fourth highest market share of sub-million dollar sales (69.9%) in four years as falling mortgage rates brought out first time buyers, skewing overall prices lower.
-Market share of sales above $5M fell sharply from 55.6% to 36.6% of luxury sales.
-Monthly absorption rate was at second fastest pace (10.3 months) since the credit crunch began from rising sales and falling inventory.
-Tight credit continues restrain demand but rates remain at record lows and continue to pull in buyers despite difficulty.
-Wall Street and International buyers remain active.

Here’s an excerpt from the report:

…The housing market on the eastern end of Long Island had its highest number of third quarter sales in six years, as inventory declined and buyers and sellers moved closer together on price. Housing prices were characterized as stable, as price indicators declined largely due to the shift towards smaller properties in response to falling mortgage rates. The market share of sales below $1M increased to 69.9% of all sales, up from 67.1% in the prior year quarter and above the five-year average of 66.5%. The shift towards lower-priced sales skewed overall housing prices lower; median sales price fell 9.3% from $700,000 in the same period last year to $635,000. In addition to the spike in sales below the $1M threshold, there was increased activity at the lower end of the luxury market…

You can build your own custom data tables on the market – now updated with 3Q 12 data. I’ll update the chart series soon. In the meantime you can browse our chart library.


The Elliman Report: 3Q 2012 Hamptons & North Fork Sales [Miller Samuel]
The Elliman Report: 3Q 2012 Hamptons & North Fork [Prudential Douglas Elliman]
Market Chart Library [Miller Samuel]
Aggregated Custom Market Data Tables [Miller Samuel]

Tags:


[More Sales] 2Q 2012 Hamptons & North Fork Report

July 27, 2012 | 10:36 am | | Reports |

We published our report on the Hamptons & North Fork sales market for 2Q 2012.   This is part of an evolving market report series I’ve been writing for Douglas Elliman since 1994.

Key Points

Hamptons & North Fork

-Sales jumped above year ago levels reaching the second highest spring market total in 6 years.
-Median sales price slipped from year ago levels, although average sales price was at 3rd highest level since credit crunch began in 2008.
-Most sales over $5M since credit crunch began – tied with 4Q 2010.
-Listing inventory edged above year ago levels.

Here’s an excerpt from the report:

…The Hamptons and North Fork housing markets were characterized as having their most active spring markets in six years, but both with weaker price levels and modest upticks in listing inventory and marketing time. There were more sales in the second quarter spring market than there have been in any second quarter throughout the past six years. The second quarter total was 676 sales, 9.2% more than 619 sales in the prior year quarter. This total was sharply above the prior quarter result of 381 sales, an unusually light number, given the mild winter and early spring selling season, which suggests a timing issue at play. Listing inventory was 2,452, 5.3% above 2,329 in the same period last year. As a result, the monthly absorption rate was 10.9 months, faster than 11.3 months in the prior year quarter as well as the 12.9-month sixyear average…

You can build your own custom data tables on the market – now updated with 2Q 12 data. You can browse our chart library for the latest – updated for 2Q 2012.


The Elliman Report: 2Q 2012 Hamptons & North Fork Sales [Miller Samuel]
The Elliman Report: 2Q 2012 Hamptons & North Fork [Prudential Douglas Elliman]
Market Chart Library [Miller Samuel]
Aggregated Custom Market Data Tables [Miller Samuel]

Tags:


[The Assessor] New WSJ Column, Includes, Well, An Appraiser (Also Hamptons Data)

April 28, 2010 | 7:35 pm | | Public |


[click to read article (subscription)]

This week’s Wall Street Journal introduces a Greater New York section that focuses on, among other things, regional real estate. They’s staffed up have been the talk of the real estate community for the past month.

The new column “The Assessor (prior names under consideration included “The Appraiser” – how cool would that be?) features a sort of factoid visual presentation of some element of regional housing each day.

Today I contributed a slice of Hamptons data, including five metrics, to focus on five towns that had the highest average sales price in the luxury section of the 1Q 2010 Hamptons/North Fork Market Overview I prepare for Prudential Douglas Elliman. However I took the towns and analyzed all the sales, not just those in the top 10% of the entire East End and compared them to the prior year quarter and prior quarter.

The idea was to take a look at a slice of the market and see how it performed. It is really a bad idea to look at individual towns for trends in that market as many attempt to do because the data sets are way too low and varied to be statistically meaningful and can be misleading. The 5 time sample size for this analysis was deemed adequate.

One thing that is clear – sales in these higher-priced towns outpaced the overall rate of sales growth suggesting that the high-end market seems to be returning to the fray. In addition, the jump in median and average sales prices do not suggest that is how prices are rising, but rather how there was a substantial shift in the mix towards high-end sales.

I’m just sayin’…

Actually I’m not saying there’s a housing recovery. We seem to be observing a return to a more reasonable mix of sales activity, rather then the substantial skew toward the lower priced market segments during 2009.


[The Housing Helix Podcast] 1Q 2010 Hamptons/North Fork Market Overview

April 25, 2010 | 6:40 pm | Podcasts |

I provide a quick recap of the East End housing market in the first quarter of 2010 as presented in our 1Q 2010 Hamptons/North Fork Market Overview.

Check out the podcast

The Housing Helix Podcast Interview List

You can subscribe on iTunes or simply listen to the podcast on my other blog The Housing Helix.


Get Weekly Insights and Research

Housing Notes by Jonathan Miller

Receive Jonathan Miller's 'Housing Notes' and get regular market insights, the market report series for Douglas Elliman Real Estate as well as interviews, columns, blog posts and other content.

Follow Jonathan on Twitter

#Housing analyst, #realestate, #appraiser, podcaster/blogger, non-economist, Miller Samuel CEO, family man, maker of snow and lobster fisherman (order varies)
NYC CT Hamptons DC Miami LA Aspen
millersamuel.com/housing-notes
Joined October 2007