
It’s time to share my Three Cents Worth (3CW) on Curbed NY, at the intersection of neighborhood and real estate in the capital of the world…and I’m here to take measurements.
Check out my 3CW column on @CurbedNY:
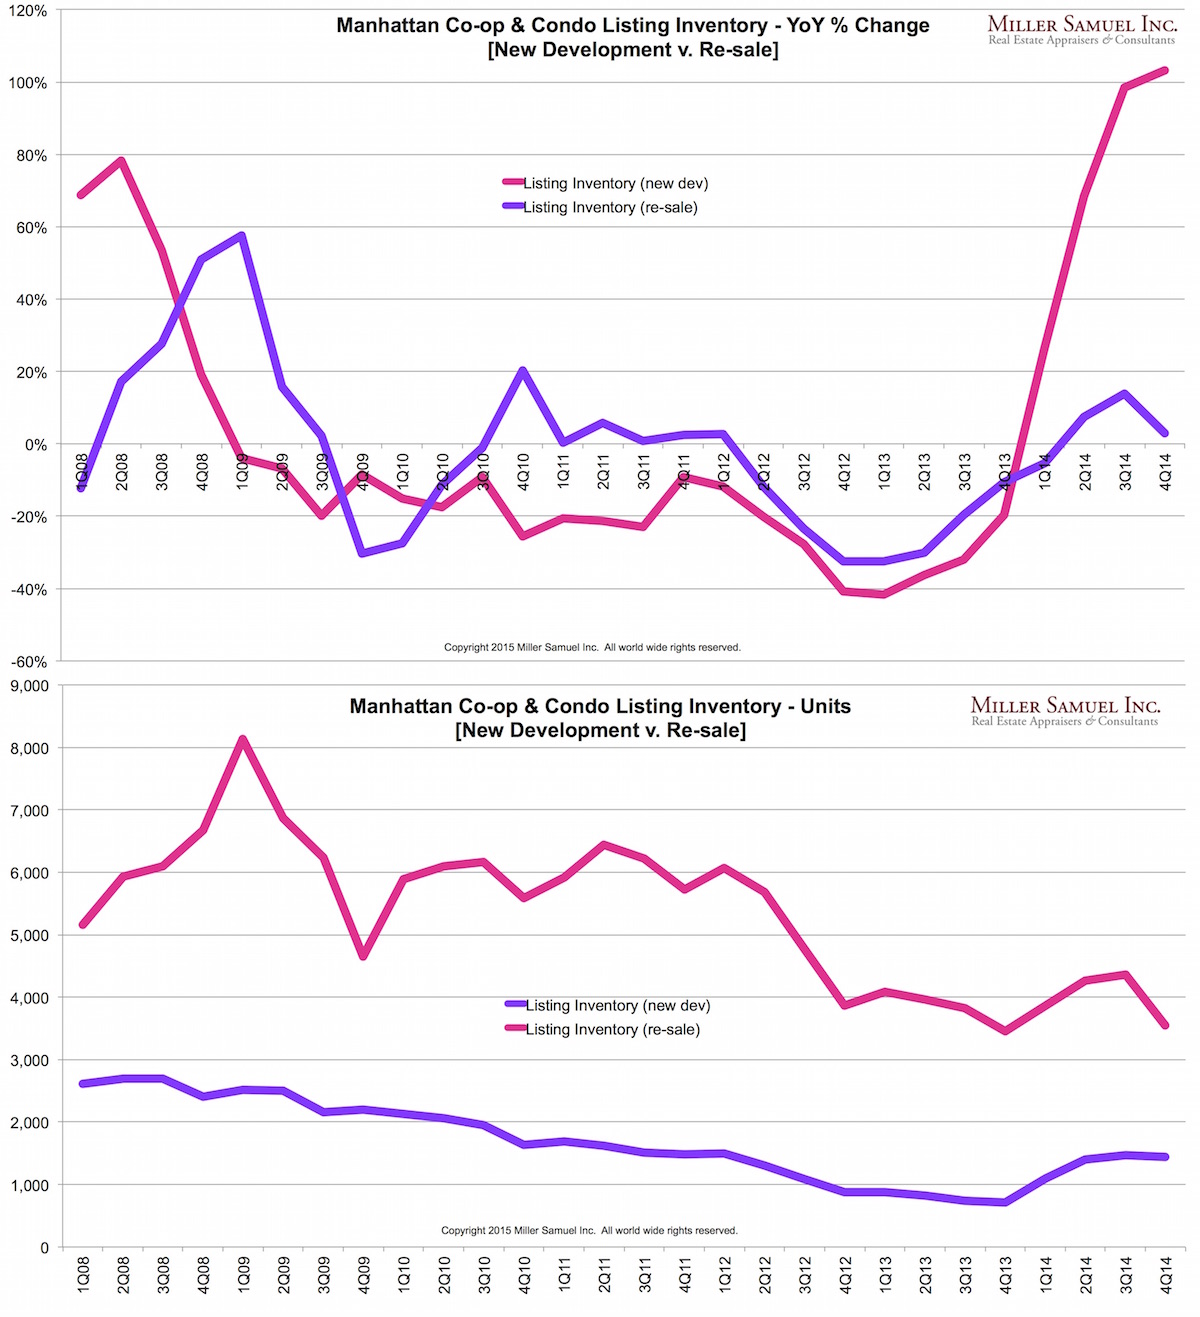
Now that I am fully recovered from Micro Week, I thought I would think a little bigger and present the Manhattan inventory picture by comparing new development and re-sales. I’ve charted it from the pre-Lehman high (PLH for those in the know) through the end of 2014 in two graphs. One shows the year-over-year change, and the other tracks inventory by units to help tell the whole story. Inventory was in a state of free fall for both types from 2009 through 2013, but in 2014 the picture clearly changed…
 [click to expand chart]
__________________________
My latest Three Cents Worth column on Curbed:
Three Cents Worth: New York’s Building Boom Doesn’t Mean More Units For Sale [Curbed]
Three Cents Worth Archive Curbed NY
Three Cents Worth Archive Curbed DC
Three Cents Worth Archive Curbed Miami
Three Cents Worth Archive Curbed Hamptons