Matrix Blog

Posts Tagged ‘Written Business’

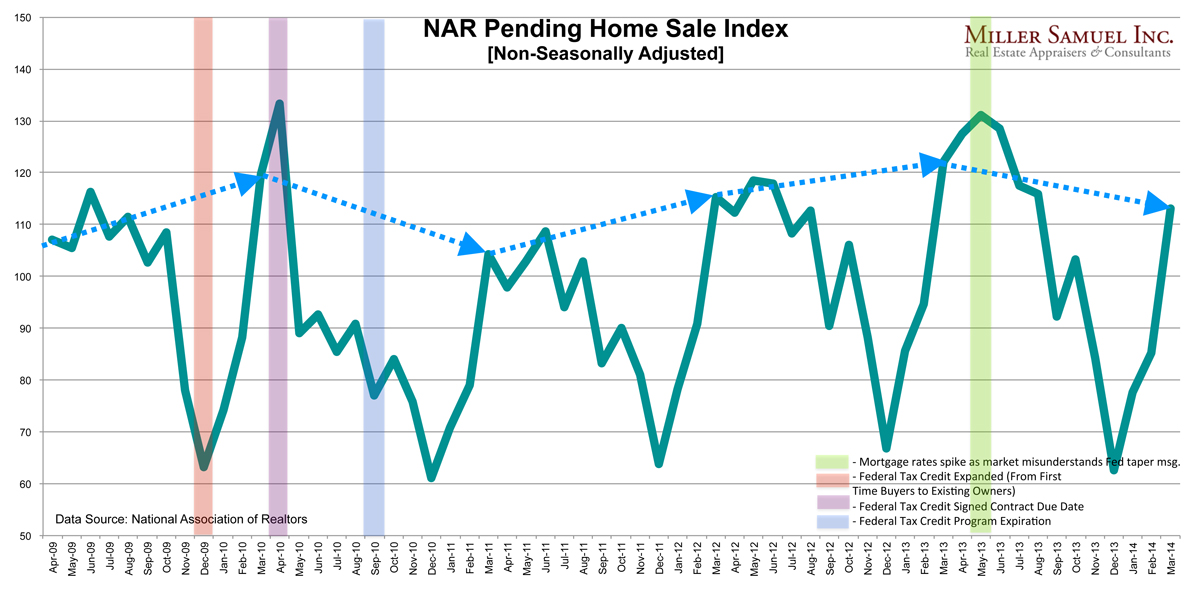
Pending Home Sales Fall Short of Year Ago Sales Surge

May 29, 2014 | 4:29 pm | Charts |

2014-april-phsi-05-29-2014
[click to expand]

The NAR released their Pending Home Sale Index today for April which aggregates signed contract data for the month. It is generally 2 months closer to the “meeting of the minds” between buyer and seller than their existing home sale report, that is based on closed sales (and 4 months faster than Case Shiller).

Pending Home Sales Index is not “forward looking”
In my chart above, and if you know me, I hate seasonal adjustments (SA) in housing data so this chart uses NAR’s reported numbers without adjustments. NAR always frames this release series as “forward looking” when it really is “less backward looking” because it is based on contracts, not closed sales. The end of May report reflects April contracts, half of which were probably signed in Late March. With a 2 month spread between contract and closing dates, this report is the most recent US housing market snapshot but nothing about it is actually “forward looking.”

With all the weather talk and mixed housing market messaging over the last month, this release brought us a broad range of interpretation, from “plunging” to “edging higher.”

Well, which is it? Or could it be both? Yes it can. We just need context.

According to Housingwire (uses SA numbers): Pending home sales plunge 9.2% in April So much for that post-winter, pent-up demand

Pending home sales for the month of April plummeted 9.2% compared to April 2013, the National Association of Realtors reported Thursday.

Contracts signed to buy existing homes increased 0.4% in April compared to March 2014, but that’s coming off three months of flat sales blamed on cold weather.

The expectation had been for at least a 2% gain month-over-month.

According to Diana Olick at CNBC (uses SA numbers), Pending home sales up just 0.4% in April, missing expectations

Warmer weather and higher expectations failed to cause a meaningful surge in home sales.

Signed contracts to buy existing homes increased just 0.4 percent in April, according to a monthly report from the National Association of Realtors (NAR). The expectation had been for at least a 2 percent gain sequentially.

The Realtors’ so-called pending home sales index is now 9.2 percent lower than April of 2013.

What’s going on?

If you look at the above chart you can see that last year’s pending home sales were surging up until May 2013, their highest level in 3 years (since the federal homeowner tax credit program as part of the stimulus). The surge in contracts in the first half of 2013 was born out of consumer fears that rates were going to rise. In addition, all the pent-up demand accumulated during the two year period preceding the US election and fiscal cliff deadline was released into the market. Many fence-sitters became decision-makers.

This winter’s harsh weather could have delayed buyers and we should be seeing this uptick in activity by now. We probably are seeing it but it no match for the year ago surge in activity but now the market is being characterized as weak or weakening. The problem with that description is it assumes that 2013 was a normal trend of an improving market. Well it wasn’t.

So yes, sales are down from the 2013 sales surge anomaly and the weather time-shifting buyers forward further into spring this year was no match for it. In fact, I suspect the next month will show the same type of “weakness” and the PHSI results probably can’t show real improvement at least until June.

Tags: , , , , ,


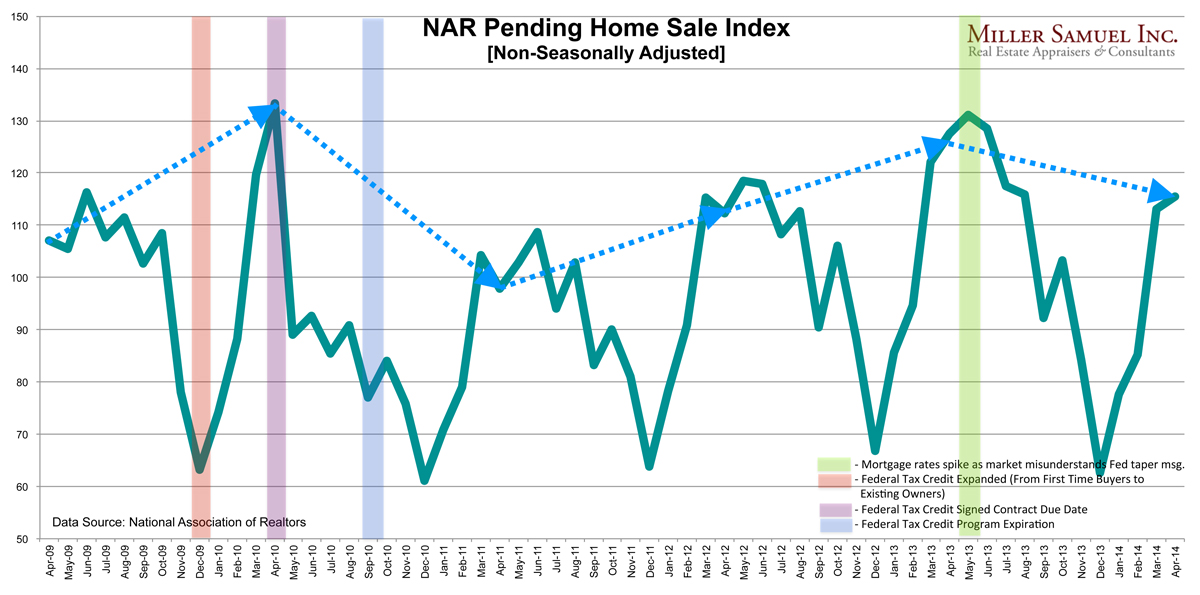
NAR Pending Home Sales Had Biggest “February to March” Jump in 4 Years

April 28, 2014 | 4:52 pm | |

4-28-14PHSI
[click to expand]

After all the housing news drama of the past month, I thought it was interesting to see the negative streak broken. Still, sales are below year ago levels after what I described as a “release of pent-up demand” that was caused by the expiration of the “fiscal cliff” and the looming rise in mortgage rates last year.

Although home sales are expected to trend up over the course of the year and into 2015, this year began on a weak note and total sales are unlikely to match the 2013 level.

All the indices NAR publishes bother me because they include seasonal adjustments and those adjustments can be very severe. The chart above has no seasonal adjustments so you can see how much adjusting has to take place to smooth out the line. I thought I’d take a look at the month-over-month data that wasn’t seasonally adjusted to see if the same pattern occurred.

4-28-14PHSIfebtomarch

Yes, month-over-month pending sales rose the most since 2010 when the market was wildly skewed (higher) as a result of the First-Time Homebuyer Credit (federal first time buyer and homeowner tax credit).

February to March 2014 had the largest increase in contracts than the same period in each year since 2010.

Tags: , , , , ,

Get Weekly Insights and Research

Housing Notes by Jonathan Miller

Receive Jonathan Miller's 'Housing Notes' and get regular market insights, the market report series for Douglas Elliman Real Estate as well as interviews, columns, blog posts and other content.

Follow Jonathan on Twitter

#Housing analyst, #realestate, #appraiser, podcaster/blogger, non-economist, Miller Samuel CEO, family man, maker of snow and lobster fisherman (order varies)
NYC CT Hamptons DC Miami LA Aspen
millersamuel.com/housing-notes
Joined October 2007