Skip to content
Services
Appraisals
Consulting
Resources
Market Reports
Charts
Matrix Blog
Articles & Research
Press
About
get in touch
Charts
› Matthew Strozier
June 9, 2010
Amenities, Adjustments & Value Logic
,
Appraising
,
Charts, Maps, Images, Infographics, Video
,
Manhattan
,
The Real Deal
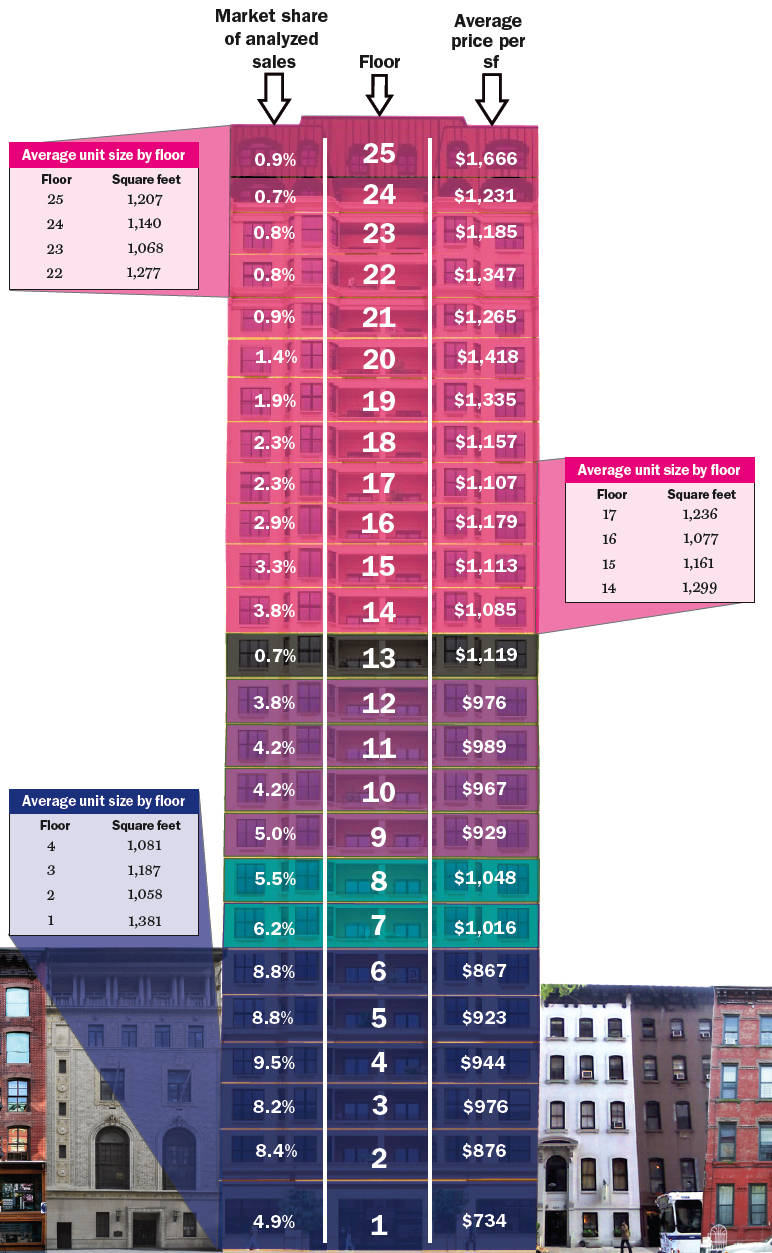
[ChartFloor] Manhattan Price Per Floor Breakdown
read more
Page load link
Go to Top