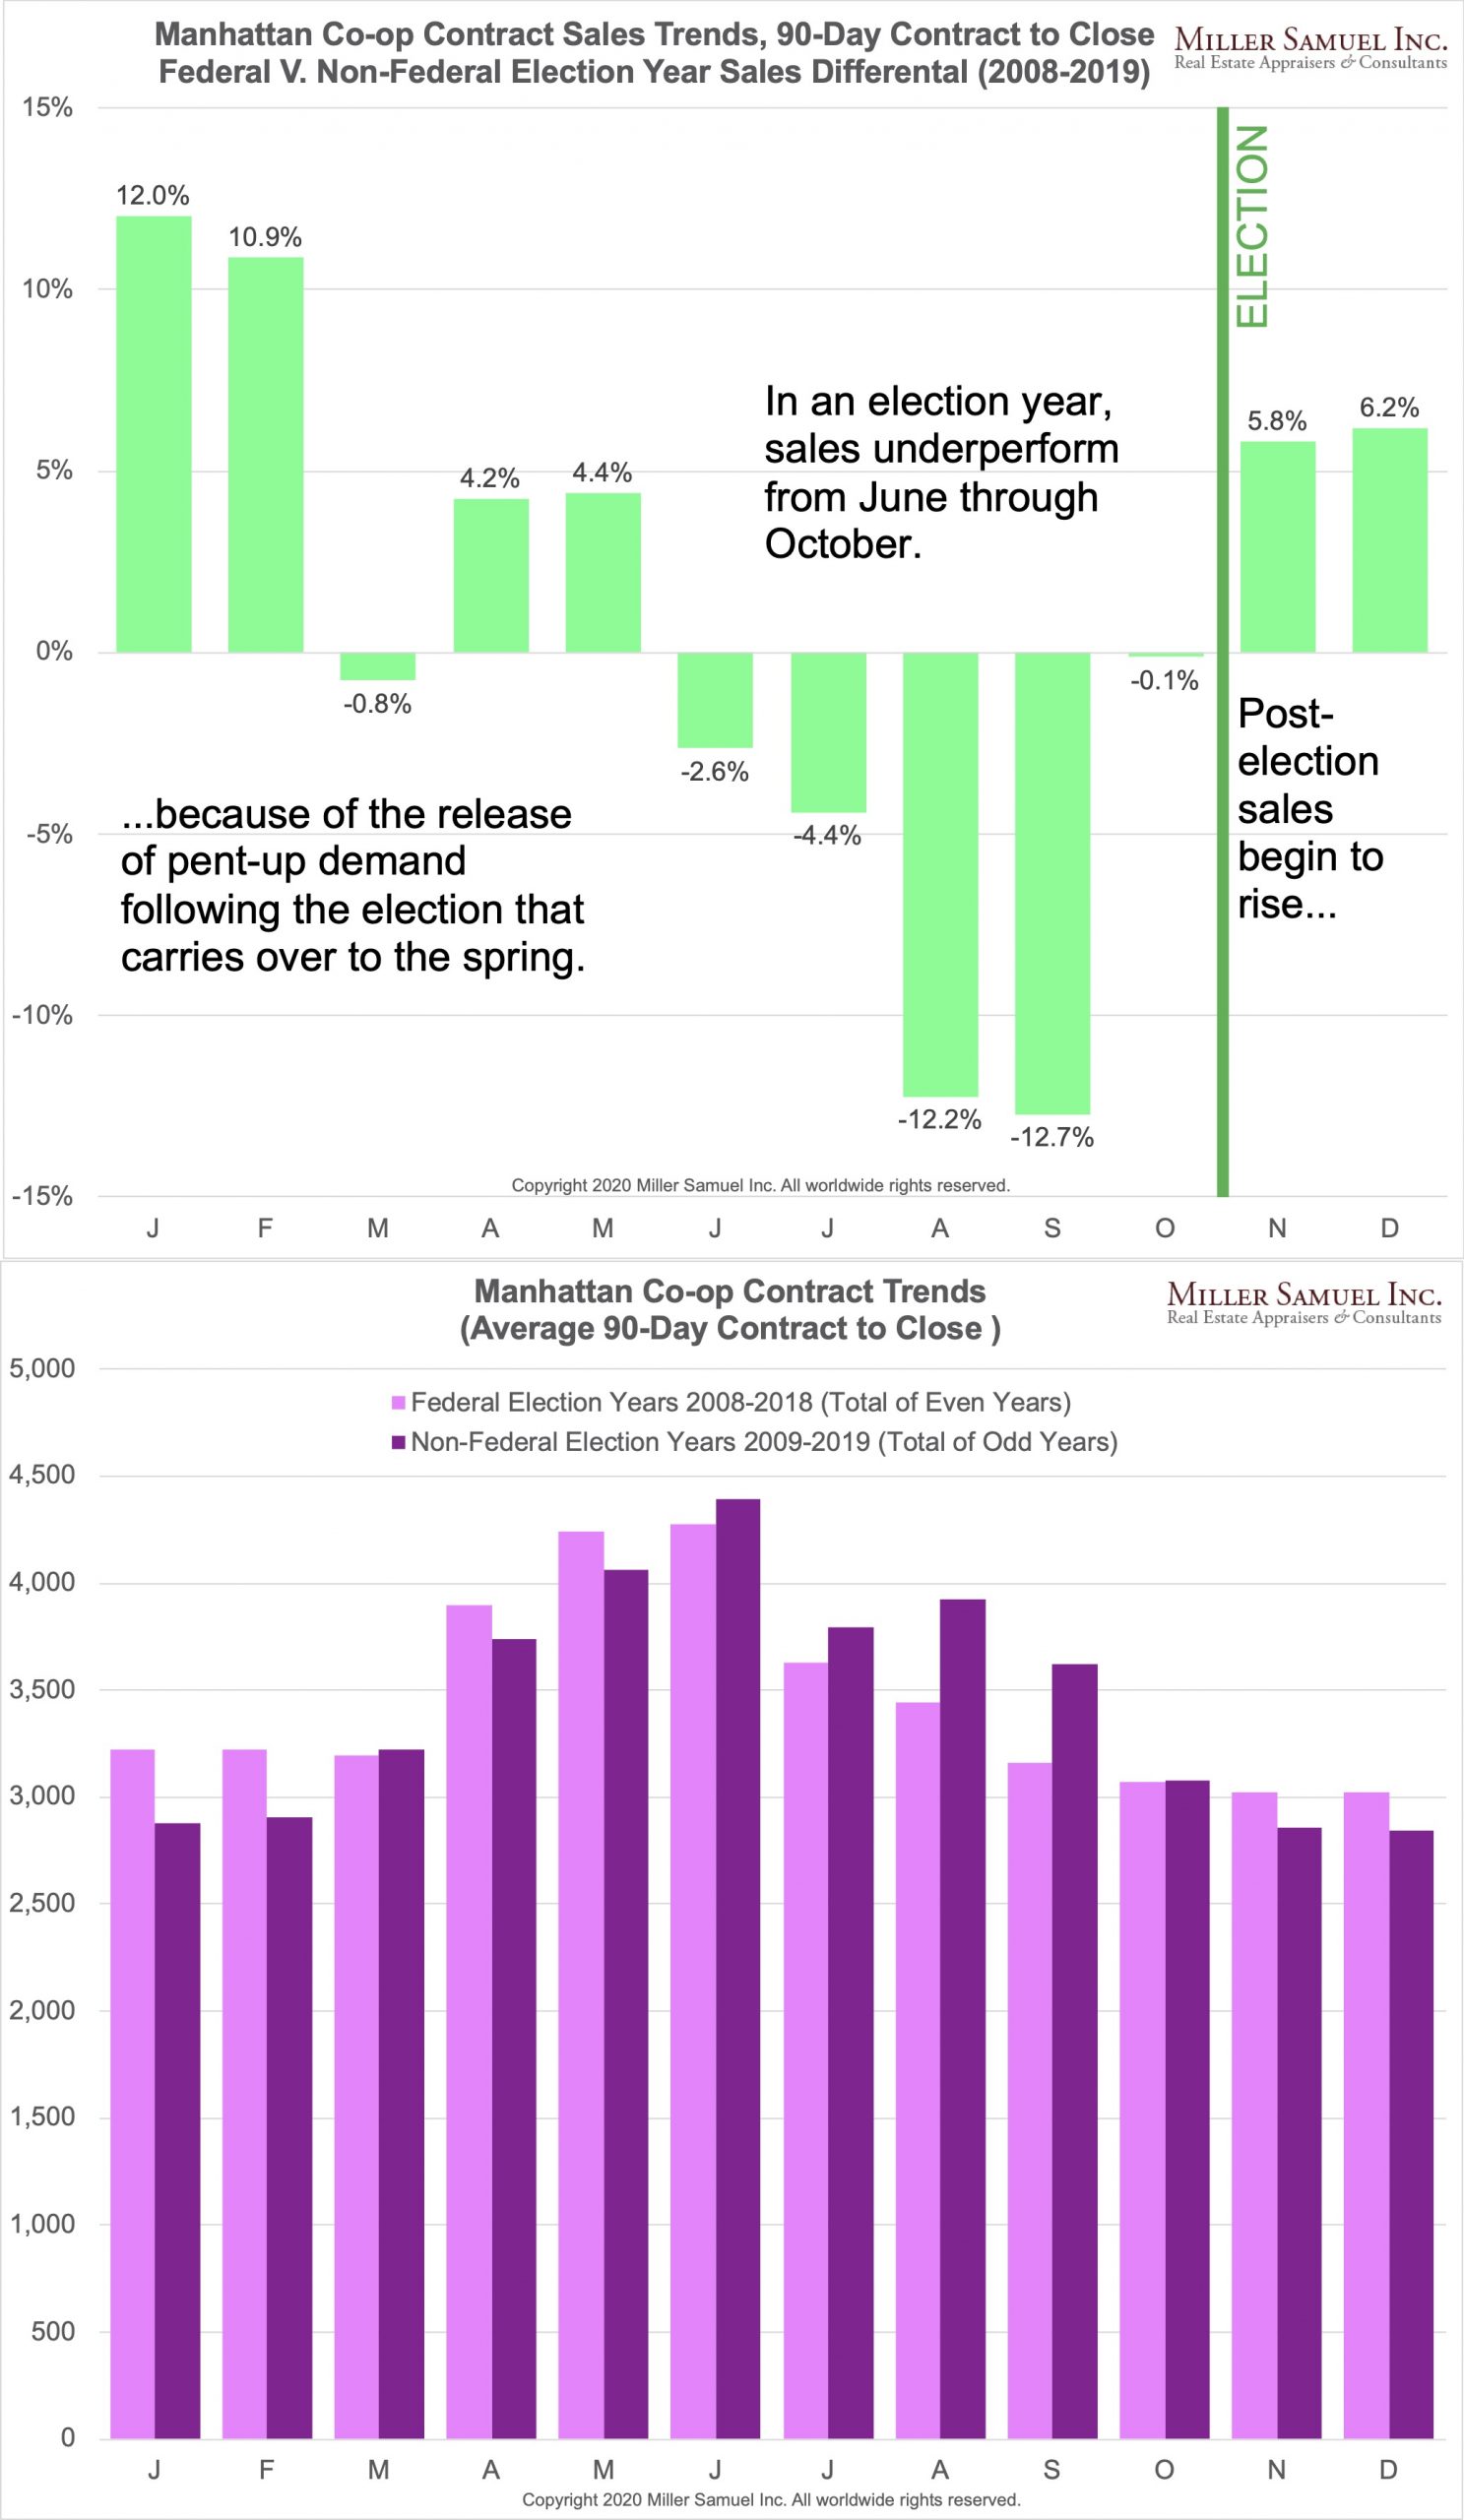
For the past decade, I’ve been observing a pullback in sales in the summer of an election year and then a release in sales after the election into the new year, no matter the party or the candidate. I was speaking about this to Sylvia Varnham O’Regan at The Real Deal Magazine, and she asked me to prove it empirically.
So I did.
Her article: This is how presidential elections really affect home sales lays it out for the Manhattan market.
My methodology:
– The data set was co-op based because they account for 74% of the apartment market and doesn’t have the wild fluctuation of contract versus closing date because of condo new development lags.
– We don’t have all the contract dates for co-ops, but for those we do, they have been remarkably consistent at around 90 days. That 90-day average was applied to all the closing dates to reverse-engineer contract dates.
– Contracts for even and odd years were compared: Even years represented federal election years, including midterms.
The results compared federal election years to non-federal election years, finding that beginning in June of an election year, sales were progressively weaker than their non-election year counterpart. The most significant difference occurred in September during an election year with a 12.7% weaker sales market than a non-election year. Beginning in November during an election year, sales overpower their non-election year counterpart, with the release of pent-up demand occurring well into the following spring.


