Confused about inflation?
Each month, the Bureau of Labor Statistics gathers 84,000 prices in about 200 categories — like gasoline, bananas, dresses and garbage collection — to form the Consumer Price Index, one measure of inflation. It’s among the statistics that the Federal Reserve considered when it cut interest rates on Wednesday.
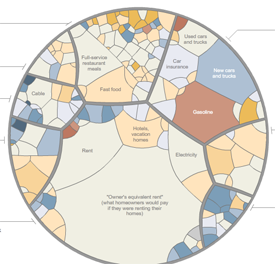
The New York Times created a CPI chart on steroids today (sorry, Jose), that is one of the best illustrations of the complicated calculation for inflation or CPI. Most importantly, housing comprises 42% of the inflation calculation and its methodology may be out of sync with reality.
Basically, the ebb and flow of housing sales was deemed not representative of owner occupancy because of investor sales, so a rental equivalent was derived in 1983.
>Until the early 1980s, the CPI used what is called the asset price method to measure the change in the costs of owner-occupied housing. The asset price method treats the purchase of an asset, such as a house, as it does the purchase of any consumer good. Because the asset price method can lead to inappropriate results for goods that are purchased largely for investment reasons, the CPI implemented the rental equivalence approach to measuring price change for owner-occupied housing. It was implemented for the CPI-U in January 1983 and for the CPI for Urban Wage Earners and Clerical Workers (CPI-W) in January 1985.
>Rental equivalence – This approach measures the change in the price of the shelter services provided by owner-occupied housing. Rental equivalence measures the change in the implicit rent, which is the amount a homeowner would pay to rent, or would earn from renting, his or her home in a competitive market. Clearly, the rental value of owned homes is not an easily determined dollar amount, and Housing survey analysts must spend considerable time and effort in estimating this value.
Of course, this is wildly flawed simply because rental markets do not perform the same as purchase markets. It could be argued that inflation was understated significantly in 1998-2005 during the housing boom years because although asset prices rose rapidly, the equivalent rents did not. And today, the sharp decline of home prices understates decline in inflation. It was felt that rental values were not as volatile as purchase values.
In other words, it was more statistically convenient for the federal government to rely on a rental equivalent. I still don’t have a great comfort level on how the rental equivalent is calculated.
Well so what?
CPI direct impacts Fed policy as well as government cost of living calculations for various payouts. It’s really a big deal. The skeptical side of me wants to think this is merely a method to keep COLA calculations low since housing prices have risen fairly regularly on an historical basis.
Bonus (admittedly inflated)
Check out flip chart video and look for “No stone throwing regardless of housing situation” and my favorite, the “pie chart of procrastination.” Worth a look.

