_Getting Graphic is a semi-sort-of-irregular collection of our favorite BIG real estate-related chart(s)._
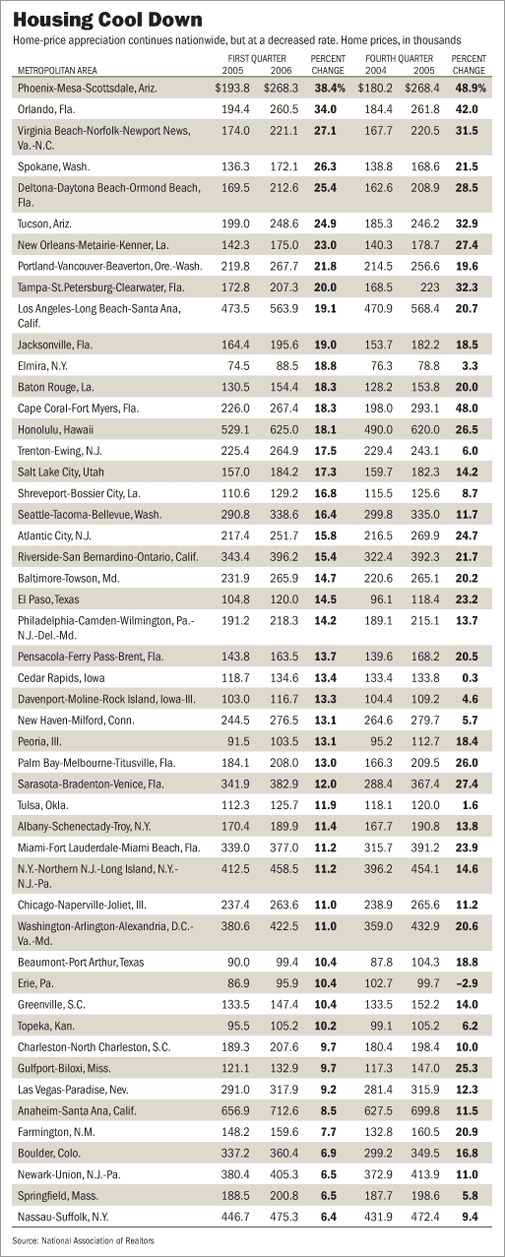
[Some Markets Start to Cool As Inventory Levels Rise; Low-Cost Cities See Uptick [WSJ]]((http://online.wsj.com/article/SB114770845366053009-search.html?KEYWORDS=housing+price&COLLECTION=wsjie/6month#HOME))>Home prices were higher in many U.S. markets in the first quarter of 2006, but the pace of growth is cooling.
_In its latest report of home prices in 149 metropolitan areas, the National Association of Realtors said the median price of a single-family home in the U.S. was $217,900 in the first quarter, up 10.3% when compared with the same quarter a year ago. That’s a smaller increase than in the fourth quarter, when the median price of a home was up about 13.6% year-over-year._
_David Lereah, NAR’s chief economist, said in a statement that home prices are rising less rapidly because the inventory of homes available for sale is rising. “With the supply of homes picking up very nicely in many areas of the country, pressure is coming off of home prices.” Mr. Lereah also indicated that the trend is continuing into the current quarter, and that he expects price-appreciation will be “returning to normal rates of price growth in the single-digit range.”_
One Comment
Comments are closed.


It appears that the median price peaked in most markets 3Q05. So 1Q 06, you still have lots of year-over-year gains, but 3Q-06 you won’t.
Note, as well, that Detroit area prices dropped hugely from 3Q 05 to 4Q 05, and are not reported for 1Q 06. Cleveland is reported, down 14% from the peak. Boston down 6.7%.
Finally, remember that in the earliest stages of a bust the median price of homes that sell usually goes up (while the number of sales goes down), as high-priced homes continue to turn over but the bottom drops out of the market. Here we have actual declines not long after a peak.