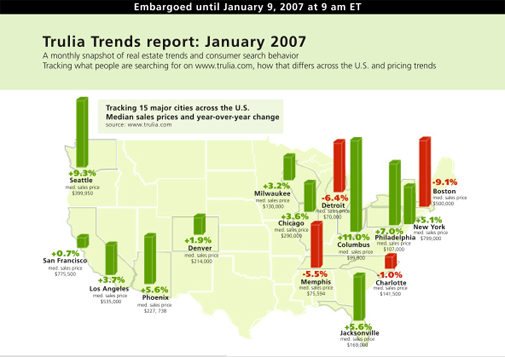
January 2007 Trulia Trends Report
After joining the real estate party a little over a year ago, [Trulia has made great strides establishing their role as a leader in the listing search business](http://www.trulia.com), working with [Realtors](http://www.realtor.com) rather than against them. Trulia has working agreements with 90 of the top 100 real estate brokerage firms with more on the way. (disclosure: I am a member of [Trulia’s advisory board](http://matrix.millersamuelv2.wpenginepowered.com/?p=1001).)
They crossed the million listing milestone last year. While impressive on that point, I think its more important to note that these are clean listings, not simply raw feeds rife with errors, duplicates, stale product or junk.
I had spoken with Trulia shortly after their initial launch with the idea of developing a market report, since I found their approach to the listing process so refreshing. The finished version now being released reflects market conditions and includes consumer search behavior.
We decided wanted to break out the market by major cities rather than as a national statistic since both Trulia and myself have serious issues with the accuracy in this type of approach, despite the fact that Trulia covers all 50 states. The list of major markets will expand and so will the metrics covered, as their service is able to build more historical content with the passing of time.
Thus the Trulia Trends Report became a reality today at 9am. Its a first step with more content and analysis to come as a collaberation between Trulia and Miller Samuel.
Download the Trulia Trends Report [PDF] here.
Download the Trulia Trends Report press release [PDF] here.
Here’s Trulia’s post about the new report.
My personal favorite section of the report is the…ahem…Matrix table on the third page. Especially the favorite neighborhoods and cities columns. Manhattan, Chicago, Philadelphia, San Francisco and Boston had favorite cities in different sections of the country and were most heavily concentrated on the east and west coasts. The searches originating from the remaining cities stayed within the same state or adjacent state.
Trulia National Heat Maps
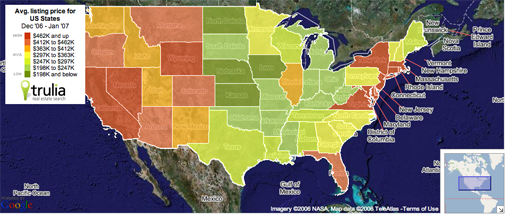
This is a dynamic resource that breaks the US up by state, county, neighborhood and zip code. Consumers can see what markets got the most traffic. This is a live resource that is continually updated.
Here’s Trulia’s post about expanded Heat Maps.
Another important announcement today (to me that is): [Apple developed an iPhone product to be released in June](http://www.macworld.com/news/2007/01/09/iphone/index.php). Thank goodness, I am about to throw my Treo out the window (and I am on a high floor).
One Comment
Comments are closed.
I have no idea what Trulia is talking about. Boston prices are down 9%??? Boston, the metropolitan area, or the entire Commonwealth of Massachusetts??? Are these single-family homes only or do they include condominiums?
The condo market within the city of Boston has not seen any drop in average and median sales prices, between 2005 and 2006. The condo market within the state dropped at most 2%.
Single-family home sales prices may have dropped, but since Trulia doesn’t state where they got their data, I can’t tell what the heck they’re talking about.