
One of the things I have found particularly aggravating during the past two years has been all the coverage on foreclosure stats. I don’t think consumers (or the media) have much perspective on the stats being produced, mainly by RealtyTrac and their competitor Foreclosure.com It’s been a groundbreaking effort on their part to collect this data but here’s a sample representing my issue with all this. I actually posted about the foreclosure data perspective problem back in September2006 (I just re-read it and it is relatively coherent) but the communication problem remains.
We see huge percentage increases every single month and yet the typical reader doesn’t really know what these stats mean in the context of all mortgages outstanding other than…it’s getting worse. I don’t think I am alone in getting the feeling that 87.4% of all houses are under foreclosure (left-handed people only, while it’s 92.3% if you include right-handed people).
Here are some examples…
From the New York Times
>Statistics on foreclosure are snapshots of a moving phenomenon, and data from the state labor department show 174 foreclosures in Belair-Edison last year, while the Community Law Center, a nonprofit public service group, counted 181; both figures are well below the more than 275 foreclosures in 2001 and in 2002.
From Forbes
> In February, Florida trailed only Nevada and California in the percentage of homes in foreclosure. RealtyTrac Inc. said 32,447 homes were in foreclosure statewide in February, up more than 69 percent from February of last year and up more than 7 percent from January.
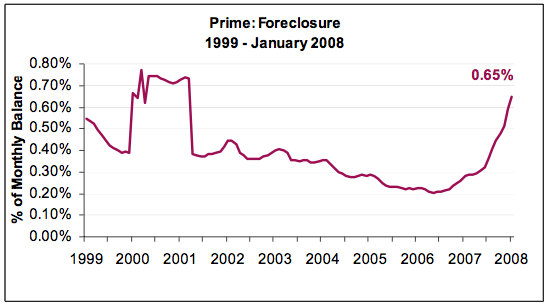
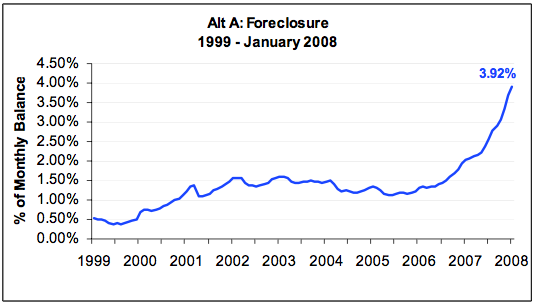
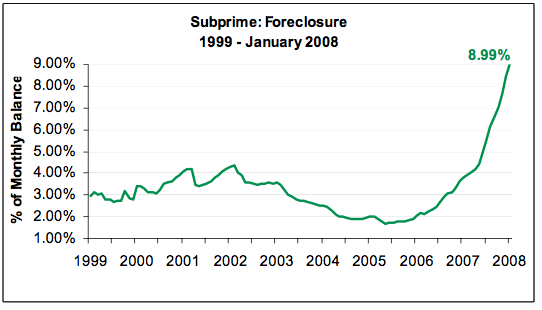
Back in October 2007, the OTS released the first Monthly Market Monitor (creatively called MMM). It referred to the mortgage problem as the “Mortgage Malaise” (2 M’s if you were wondering) The most recent issue was released on wednesday referring to the mortgage markets in “disarray”. The MMM charts are really useful because they show the pace of foreclosures in an historical context and the amount of foreclosures relative to the amount of mortgages outstanding. The info on these charts are what we need to see more of.
Here’s a housing summary from the March 2008 report:
> The slump in the housing market has not only impacted residential construction, but lending and loan performance have deteriorated in concert. Nonâ€conforming loan originations fell 49 percent in the fourth quarter, as the secondary market for bonds backed by the collateral is still shuttered. According to data collected by Inside Mortgage Finance, approximately $84.5 billion of nonâ€conforming loans were originated in the quarter ending in December 2007, comprising just 19.9 percent of total loan production. This is the lowest volume of originations ever, and is a far cry from the peak origination period of 2005, when the total reached $1.58 trillion, or 50.4 percent of all production.6 By loan type, jumbo production fell 47 percent in the fourth quarter, plummeting to $44 billion, or less than 10% of all originations. The downturn in Altâ€A and subprime loan production persist, with fourth quarter volume at $27 billion and $13.5 billion, respectively.
>In contrast to nonâ€conforming product, FHA/VA loan production rose steadily in 2007, from a low of $19.0 billion in the first quarter to $31.0 billion at the end of the year. Activity in governmentâ€insured lending was twice that of subprime.
Even Treasury Secretary Paulson is giving us better perspective of foreclosure stats in his speech to the US Chamber of Commerce on Wednesday:
>Home foreclosures are also a significant issue today. Foreclosures are painful and costly to homeowners and, neighborhoods. They also prolong the housing correction by adding to the inventory of unsold homes. Before quickly reviewing our initiatives to prevent avoidable foreclosures, let me observe that some current headlines make it difficult to put foreclosure rates in perspective. So let me try to do so.
>First, 92 percent of all homeowners with mortgages pay that mortgage every month right on time. Roughly 2 percent of mortgages are in foreclosure. Even from 2001 to 2005, a time of solid U.S. economic growth and high home price appreciation, foreclosure starts averaged more than 650,000 per year.
>Last year there were about 1.5 million foreclosures started and estimates are that foreclosure starts might be as high as 2 million in 2008. These foreclosures are highly concentrated – subprime mortgages account for 50 percent of foreclosure starts, even though they are only 13 percent of all mortgages outstanding. Adjustable rate subprime mortgages account for only 6 percent of all mortgages but 40 percent of the foreclosures. So we are right to focus many of our policies on subprime borrowers.
>There are approximately 7 million outstanding subprime mortgage loans. Available data suggests that 10 percent of subprime borrowers were investors or speculators. This figure is likely higher, as some investors misrepresented themselves to take advantage of a cheaper rate, and others speculated on a primary residence, expecting prices to continue going up.
And if you can’t keep track of foreclosures because it’s too confusing, try something simple like converting your phone number into words.
2 Comments
Comments are closed.
[…] only, while it’s 92.3% if you include right-handed people)."Please read Jonathan Miller, [OTS] Foreclosures: From Malaise to Disarray. Despite these facts, I do expect a government bailout paid for by the taxpayers who continue […]
Those are great charts.
They need another line, though. Raw numbers or something to put it into perspective since, from what you quote, only 6% of loans were to subprime ARM borrowers.
Also, since the entire “pie” has increased since 1991-1992, with a lot more loans written over the past several years, we need the raw #s so we can determine whether this is “worse”.