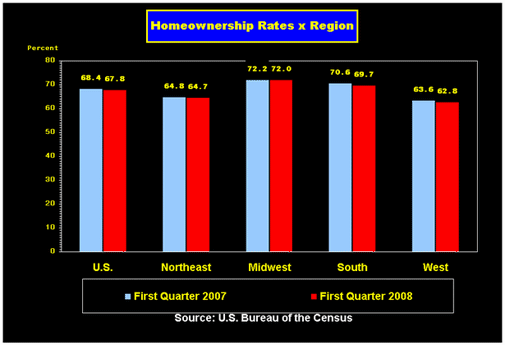
First Quarter 2008: Graph of Homeownership Rates
Interesting how much homeownership rates vary by region. The midwest has the highest rate, yet they saw the least change in price appreciation during the housing boom. Markets in the west and northeast have the lowest rates (and the highest home prices).
Hmmm, let me see…. higher prices = lower affordability = lower home ownership rates = more creative financing.
2 Comments
Comments are closed.


It should also be noted that the profile of the current and typical buyer/owner has moved to more of risk taker with little to no commitment in the property as long term shelter but as investment vehicle. The profile of the property owner of today is more likely to walk away from the property than ride out the market because they have no cash money equity to lose since it was financed at 100% at time of purchase.
Whiole it is certainly tru tht recent lending rules resulted in too many (maybe one is too many!) “80/20” loans, I would need to see some sources to back of your assertion that this is now the “typical” homewoner. It is probay the “typical” owner in default. But not everyone bought (or refinanced) during the time of lending madness. I doubt very much that those who did outnumber those who did not– it defies logic. The boomer genaration is quite large and we, by and large, knew better.
But we shall see!