Getting Graphic is a semi-sort-of-irregular collection of our favorite BIG real estate-related chart(s).
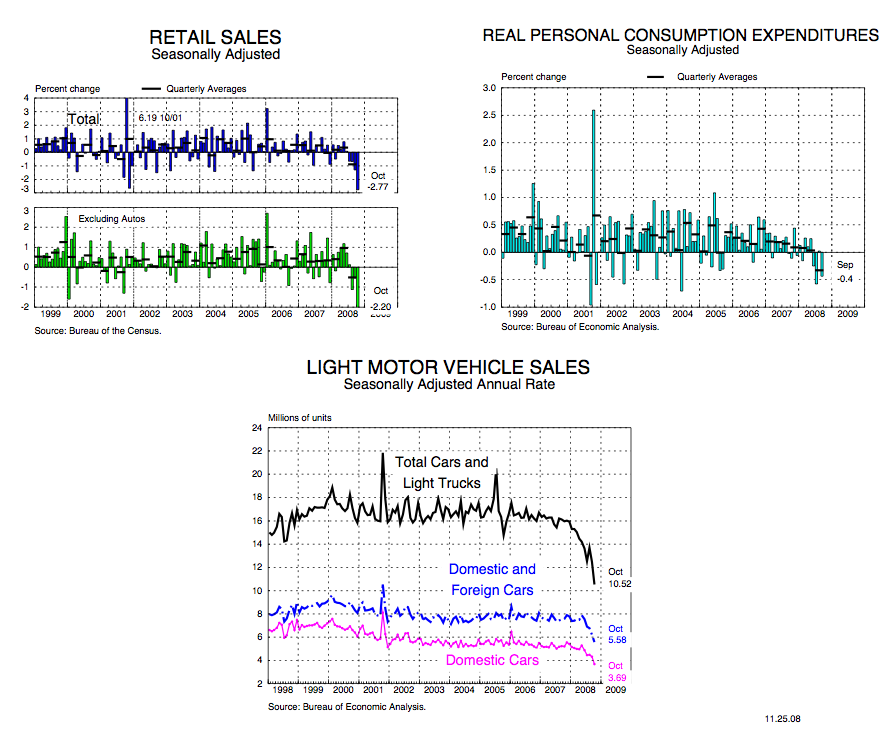
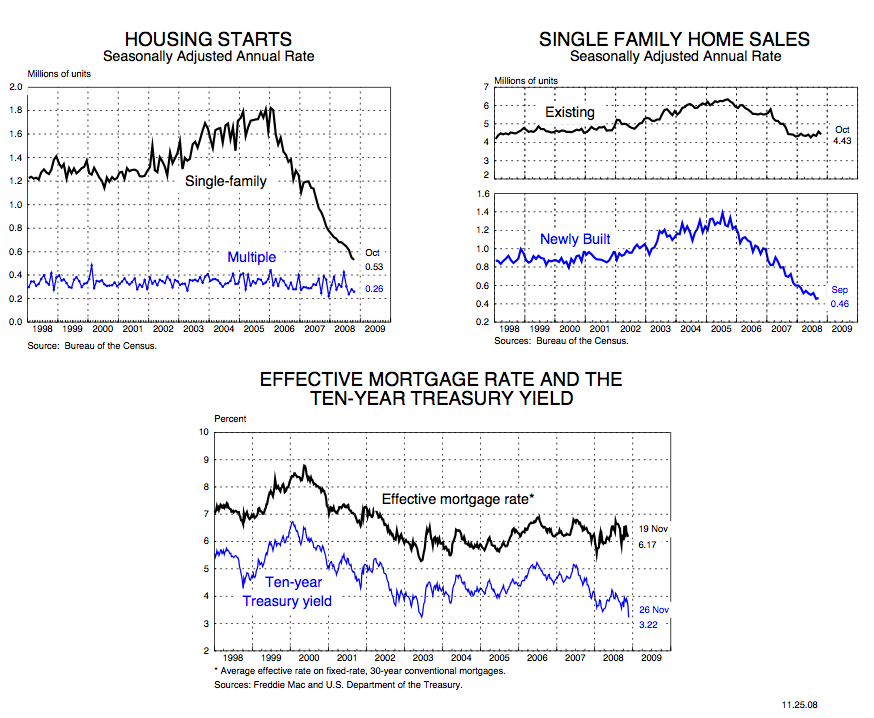
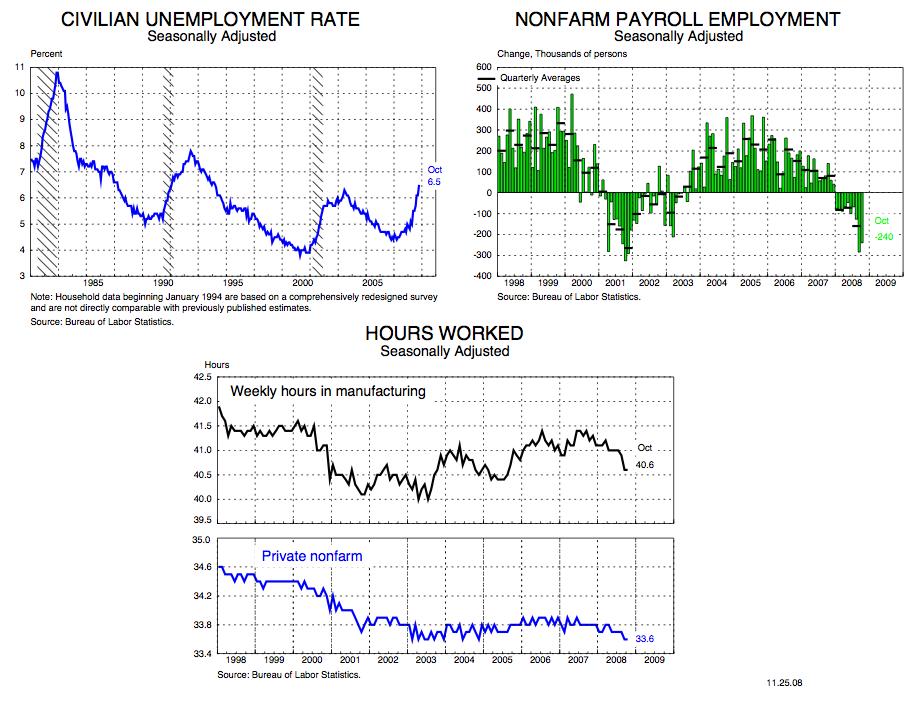
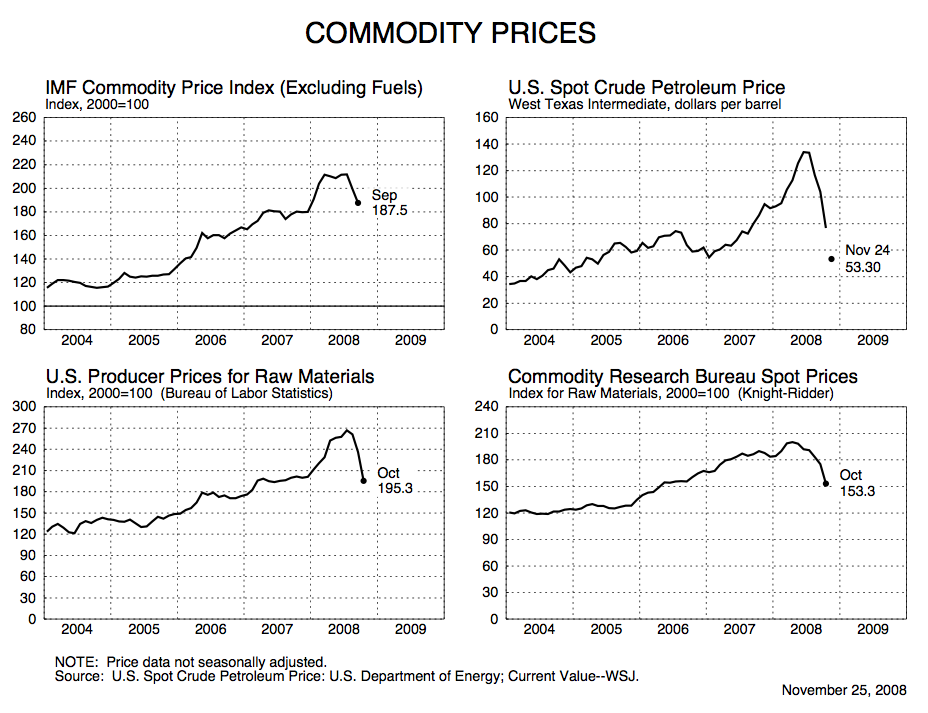
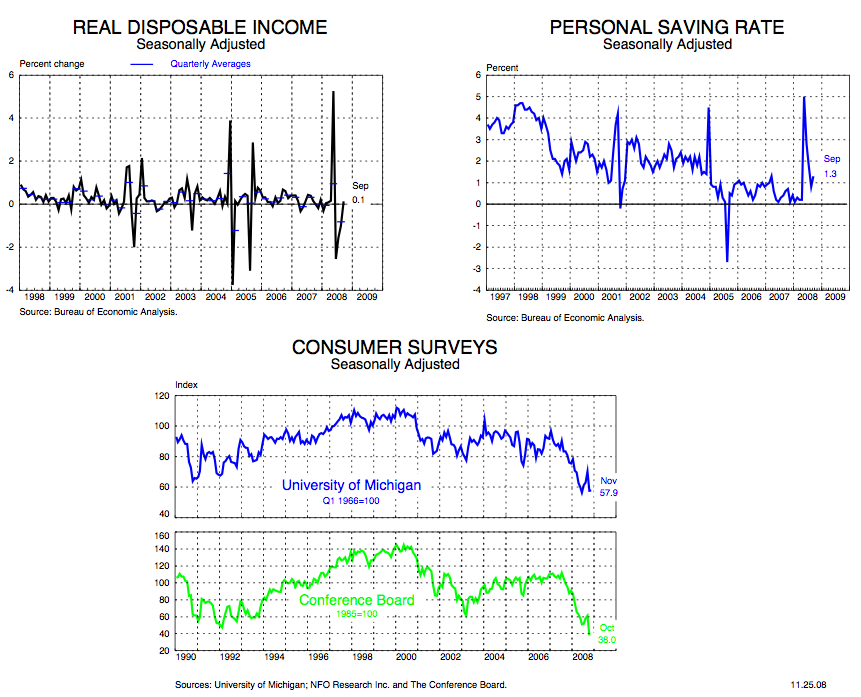
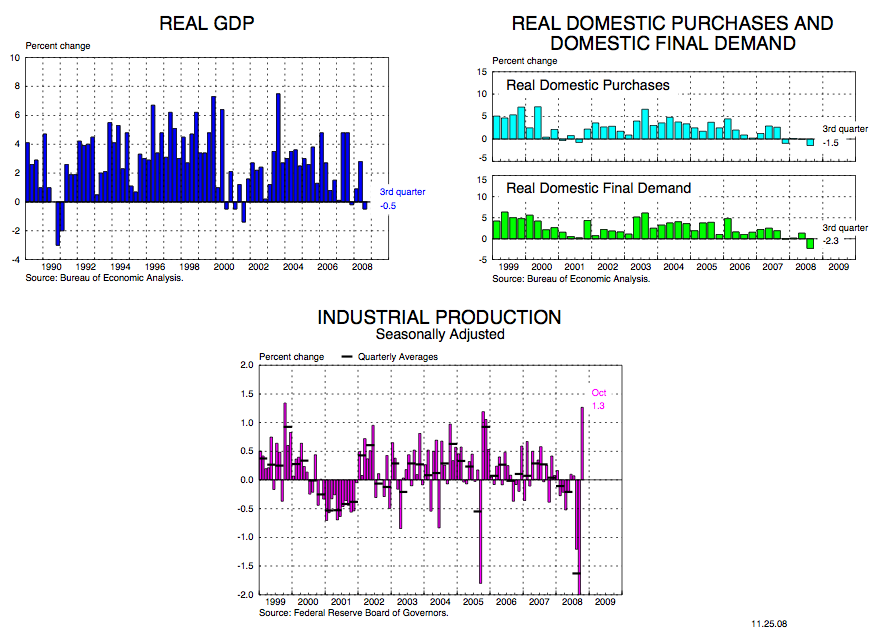
Here’s a slew of easy to understand charts from the Federal Reserve Bank of New York on the key national economic indicators that relate to housing such as consumption, housing starts and sales, employment, oil, consumer confidence, GDP and others. They tell a consistent story.
My favorites are below (here are all of them/expanded in size):

