Here is an interview I recently did for Bloomberg Television’s In The Loop on the first phase of the long awaited and sorely needed Second Avenue subway line. I had also looked at this data about two years ago.
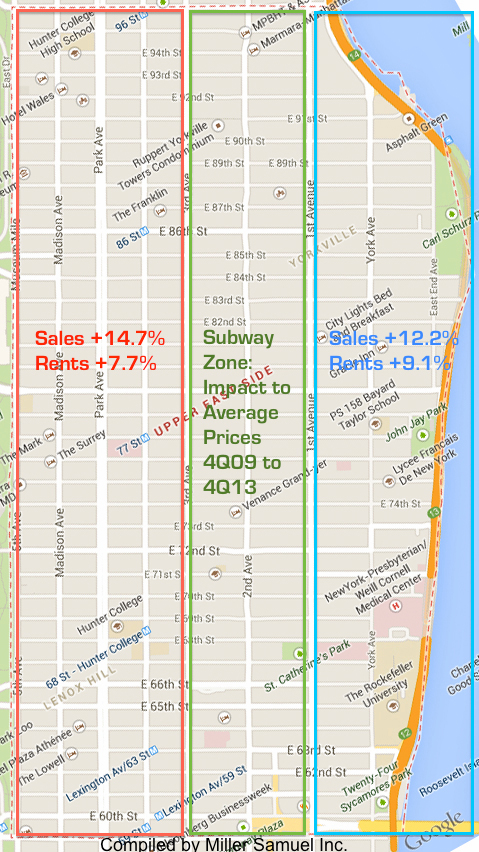
For the show I crunched closed sales data for the 4th Quarter of 2013 versus the same period in 2009 and provided a similar time frame for the rental market. I defined the impacted subway zone as the Upper East Side neighborhood between Third Avenue and First Avenue extending from 96th Street to 59th Street. Areas out side the zone were simply those to the east and west of it but within the neighborhood. I realize that simply taking the average price of all transactions in each of the zones are subject to skew. However given the large size of the zones, I think it is a reasonable way to extract some sort of impact.
Based on the results, the subway zone fell behind the areas outside the zone during the 4 year time span.
West of Zone
Sales Prices +14.7%
Rental Prices +7.7%
East of Zone
Sales Prices +12.2%
Rental Prices +9.1%


