 [click to expand]
The Case Shiller Index was released today and it continued to confuse consumers, pundits, economists etc…and for good reason. It’s 6 months late.
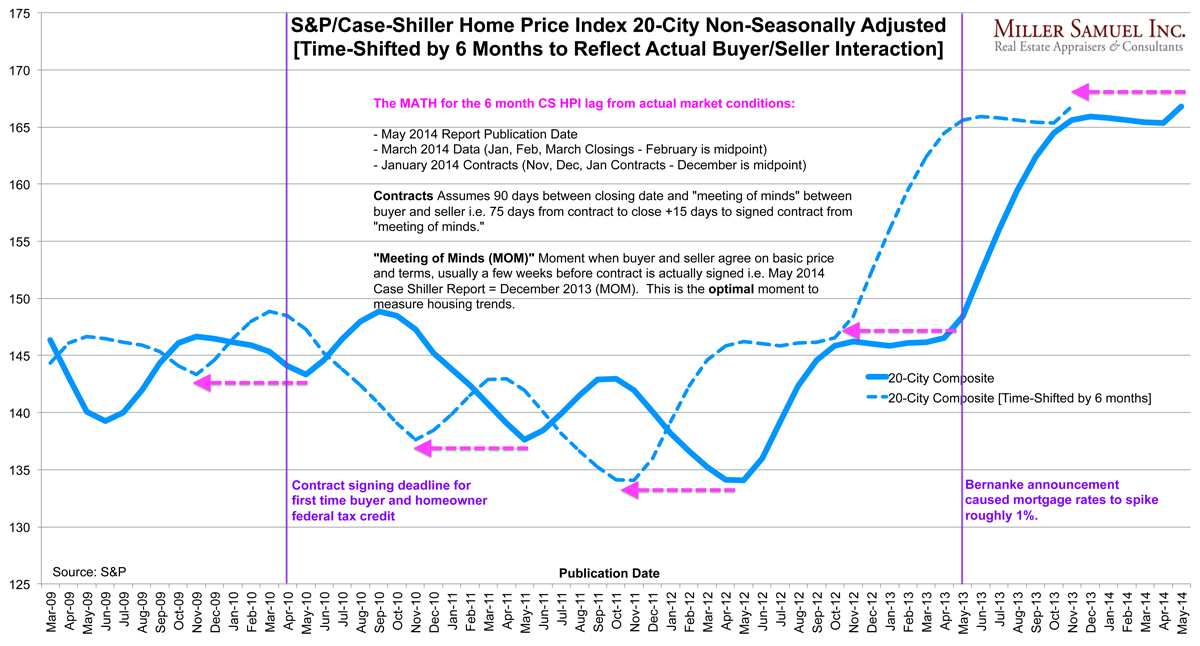
I wondered what would happen if their index result was pulled back by 6 months to see how it lined up with a couple of significant housing milestones (purple vertical lines). The most recent housing milestone was last year’s Bernanke speech that resulted in the spike in mortgage rates in May-June of 2013.
In the modified trend line (dotted blue) housing prices surge up until mortgage rates spike. This is clearly more logical than the actual index showing housing prices surging for six months after the mortgage rate spike.
In the earlier milestone in April 2010, the adjusted index (dotted blue line) immediately begins to slide after the April 2010 signed contract deadline passed to qualify for the federal homeowner tax credit as part of the stimulus plan. Yes, that’s exactly what happened on the front lines.
I’m going to call this new methodology “time-shifting a housing index.” From an historical perspective, this is a much more useful and reliable trend line. For the near term, it places the CS HP 6 months behind the market without any relevance to current conditions. Then again, the S&P/Case Shiller Home Price Index was never meant to be a monthly housing indicator for consumers as it is currently used by the media. It was originally created to enable Wall Street to hedge housing but never caught on because of the long time lag and therefore the eventual ability of investors to accurately predict the results.
________________________
The top chart is fairly self-explanatory but here’s the math again:
– May 2014 Report Publication Date
– March 2014 Data (Jan, Feb, March Closings – February is midpoint)
– January 2014 Contracts (Nov, Dec, Jan Contracts – December is midpoint)
Contracts Assumes 90 days between closing date and “meeting of minds” between buyer and seller i.e. 75 days from contract to close +15 days to signed contract from “meeting of minds.”
“Meeting of Minds” Moment when buyer and seller agree on basic price and terms, usually a few weeks before contract is actually signed i.e. May 2014 Case Shiller Report = December 2013. The optimal moment to measure housing.
Here’s a regular chart that has a longer timeline, with and without seasonal adjustments (you can see that seasonal adjustments are essentially meaningless.)
