We published our 4Q 2012 reports for both The Hamptons and North Fork. Since this was the final quarter of 2012, we also released our Hamptons/North Fork Decade report, a ten year moving window data compendium of the Hamptons/North Fork market from 2003-2012
This is part of an evolving market report series I’ve been writing for Douglas Elliman since 1994.
Key Points
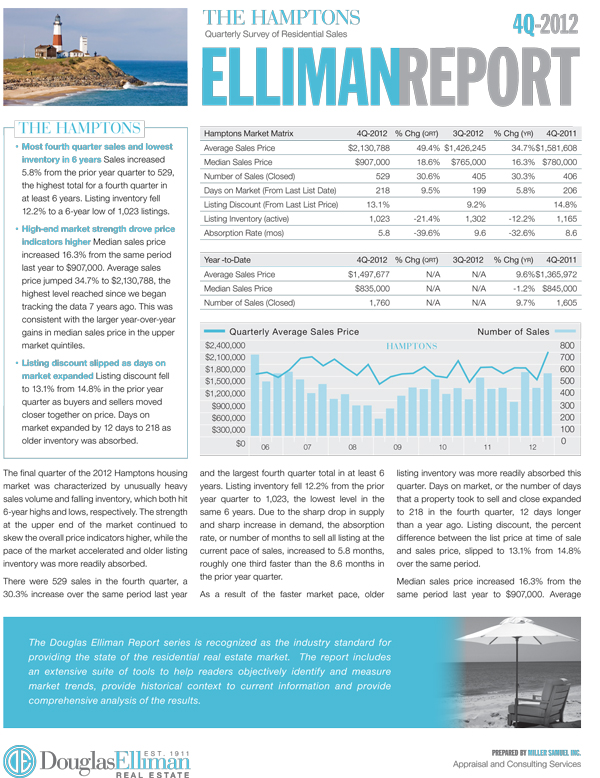
HAMPTONS 4Q 2012
– Most fourth quarter sales and lowest level of inventory in 6 years.
– Highest average sales price in 7 years, skewed by high end market strength.
– Days on market expanded as older listings were absorbed due to lack of supply.
– Credit remains tight as economy slowly improves.
– Inventory falling – low to negative equity, no urgency to list.
– Sales rising as record low mortgage rates create demand.
– A release in pent-up demand from election year and “fiscal cliff” concerns over rising taxes.over rising taxes.
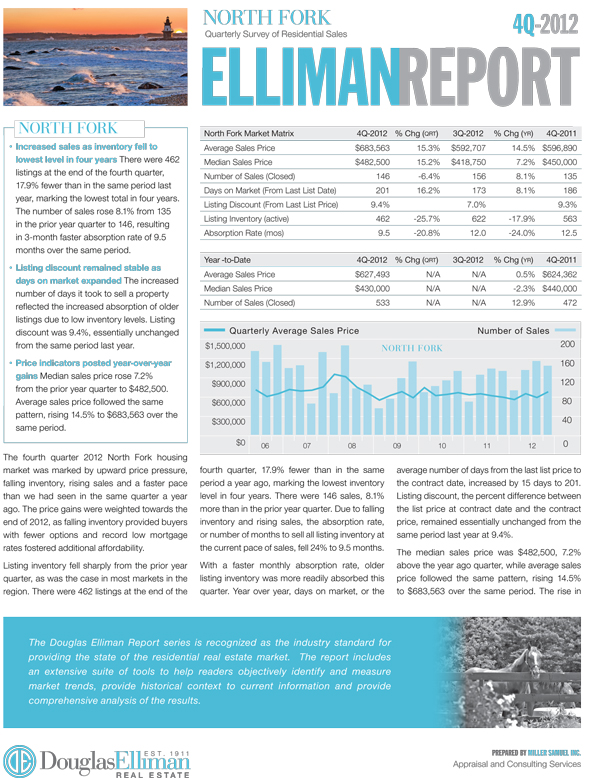
NORTH FORK 4Q 2012
– Inventory at lowest level in four years.
– Sales rising from record low mortgage rates and pent-up demand.
– Credit remains tight as economy slowly improves.
– Inventory falling – low to negative equity, no urgency to list.
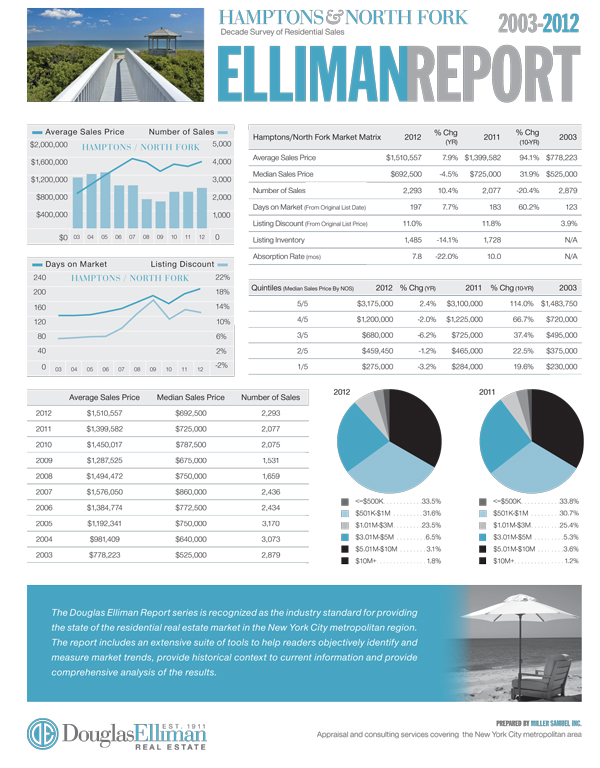
HAMPTONS/NORTH FORK 2003-2012
– Median sales price up 31.9% over decade.
– Average sales price nearly doubled, reflecting emphasis on luxury market over the decade.
– Number of sales 20.4% less than in 2003.
– Days on market 2 months slower than in 2003.
Here’s an excerpt from the 4Q 2012 report:
HAMPTONS…The final quarter of the 2012 Hamptons housing market was characterized by unusually heavy sales volume and falling inventory, which both hit 6-year highs and lows, respectively. The strength at the upper end of the market continued to skew the overall price indicators higher, while the pace of the market accelerated and older listing inventory was more readily absorbed…
NORTH FORK…The fourth quarter 2012 North Fork housing market was marked by upward price pressure, falling inventory, rising sales and a faster pace than we had seen in the same quarter a year ago. The price gains were weighted towards the end of 2012, as falling inventory provided buyers with fewer options and record low mortgage rates fostered additional affordability…
You can build your own custom data tables on the market – now updated with 4Q 12 and annual 2003-2012 data. I’ll post the updated charts soon. In the meantime you can browse our chart library.
_________________
The Elliman Report: 4Q 2012 Hamptons Sales [Miller Samuel]
he Elliman Report: 4Q 2012 North Fork Sales [Miller Samuel]
The Elliman Report: 2003-2012 Hamptons/North Fork Decade [Miller Samuel]
The Elliman Report: 4Q 2012 Hamptons Sales [Douglas Elliman]
The Elliman Report: 4Q 2012 North Fork Sales [Douglas Elliman]
The Elliman Report: 2003-2012 Hamptons/North Fork Decade [Douglas Elliman]
Market Chart Library [Miller Samuel]
Aggregated Custom Market Data Tables [Miller Samuel]
One Comment
Comments are closed.


[…] Real Estate News, Real Life Real Estate, smart money We are seeing more “positive” real estate reports published these days. As a matter of fact, the most positive reports since the crash of 2008. The […]