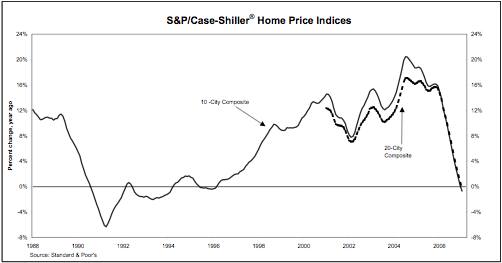
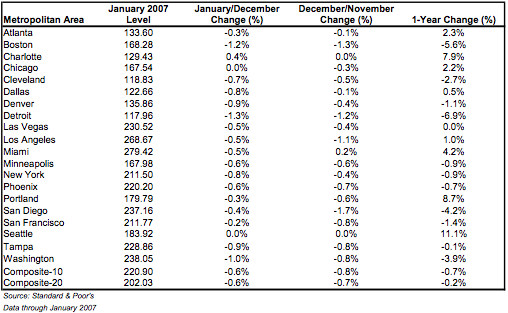
Professor Robert Shiller has leveraged his repeat sales index by developing a new monthly national housing market report with Standard & Poor called S&P/Case-Shiller® Home Price Indices. I find that repeat sales indexes can be very inaccurate and lag the market because they don’t reflect changes in the houses being measured for multiple sales, the data set is too thin, and the response to sudden changes in a market is delayed. This particular report addresses composites of 10 and 20 metro areas so its not really a national housing market indicator since metro areas are distinctly different markets than outlying areas. However, the index seems to address one of their biggest flaws:
>Their purpose is to measure the average change in home prices in a particular geographic market. They are calculated monthly and cover 20 major metropolitan areas (Metropolitan Statistical Areas or MSAs), which are also aggregated to form two composites – one comprising 10 of the metro areas, the other comprising all 20. The indices measure changes in housing market prices given a constant level of quality. Changes in the types and sizes of houses or changes in the physical characteristics of houses are specifically excluded from the calculations to avoid incorrectly affecting the index value.
>“The annual declines in the composites are a good indicator of the dire state of the U.S. residential real
estate market,” says Robert J. Shiller, Chief Economist at MacroMarkets LLC. “ The 10-City and 20-city
Composites are both showing negative annual returns, a striking difference from the 15.1% and 14.7%
returns they reported this time last year. The dismal growth in the 10-City composite is now at rates not
seen since January 1994.”
Its the first time in 11 years that home prices go negative. A possible theory for the weakness is relating to the interplay between new home sales and existing home sales. I am not sure I buy into it but its interesting to consider nevertheless.
The lag in timing on this index is really showing the markets around the November 2006 election since the study is based on January 2007 closings. At -0.2% and -0.7% for the 10 and 20 city composite, its is a significant drop from the 15% annual appreciation rates seen a year earlier but not unexpected.
I know economists are paid to worry, and I am not cheerleading here, but does Professor Shiller have to use the word dire in his description?
10 Comments
Comments are closed.


It’s about the least subjective measure we have. It’s far better than zillow and way more insightful than tracking medians.
True, its definitely useful and better than NAR’s median. I guess I worry about terminology used in its interpretation.
The difference between repeat sales and the NAR may become much more important given current market conditions.
I expect the subprime meltdown will reduce the sales of entry level homes. If higher-cost homes continue to sell, the median existing sales price will rise even though the value of any given house falls.
This will further condition sellers to hold out for far more than buyers can really afford, add to the ever-diminishing financial future of younger generations, and prevent the market from clearing.
WT Economist – Interesting. But I wonder… isn’t a repeat sales index subject to the same bias? If entry level properties drop out of the market (stop selling) then there is no repeat sale, hence they are not represented.
I guess I’m not really sure what the repeat sales method is.
But I assumed it measured the trend in all sales based on houses that do sell, scaled proportionally to a regional average.
If the same house sells in 1994 and 2005, you take that as the measure of price change between those years. If a different house sells in 2000 and 2006, you take that as the price change between those years.
They you scale it to the entire inventory. And if you found that houses selling 1995 and 2005 were up 100%, and houses selling in 1995 and 2006 were up 85%, then you have a 15% decline in 2006 — if that matches other year combinations as well.
Repeat sales method takes each sale and compares the price paid versus its prior sale and then you combine the change in aggregate over a specific period – shiller apparently adjusts or factors for changes in the house – ie an extension. I’m not sure how this is done and it won’t consider an extensive renovation, for example nor does this index consider foreclosures or new development (its the first time sold so there is no repeat).
Jonathan,
Case-Shiller picks up foreclosure sales between the bank and the market, not the mortgagee and the lender. From the methodology paper:
“… Although identified foreclosure transfers are excluded during the pairing process, subsequent sales by mortgage lenders of foreclosed properties are candidates to be included in repeat sale pairs.”
New developments are not included because the methodology requires at least two recorded transactions prior to admmission into the index.
Since Case-Shiller and OFHEO are repeat sales based indexes, there is “slippage” in the sense that untraded iventory is not absorbed in the indexes. (As correctly noted above.) If there was an appraisal method, then a value could be guess-timated. However, over the long run, all these properties will eventually transact and will then be accounted for in the indexes.
Does the NAR data include foreclosure sales? If not, they may be missing a big part of the market over the next couple of years.
check this link out
There is a Case-Shiller index that tracks national housing prices. The index symbol is SPCSUSA. It updates quarterly instead of monthly. It is being traded as a forward over-the-counter (OTC), not as a listed futures contract. The forward market for expiration February 2010 is -12% bid, -4.25% offered. The derivatives market views nationwide housing prices as expressed by this Case-Shiller index as substantially lower looking out three years.