I always like to parse out press release of the NAR Existing Home Sales Report using their data but presented it with proper emphasis. I believe these charts are better ways to interpret the report results.
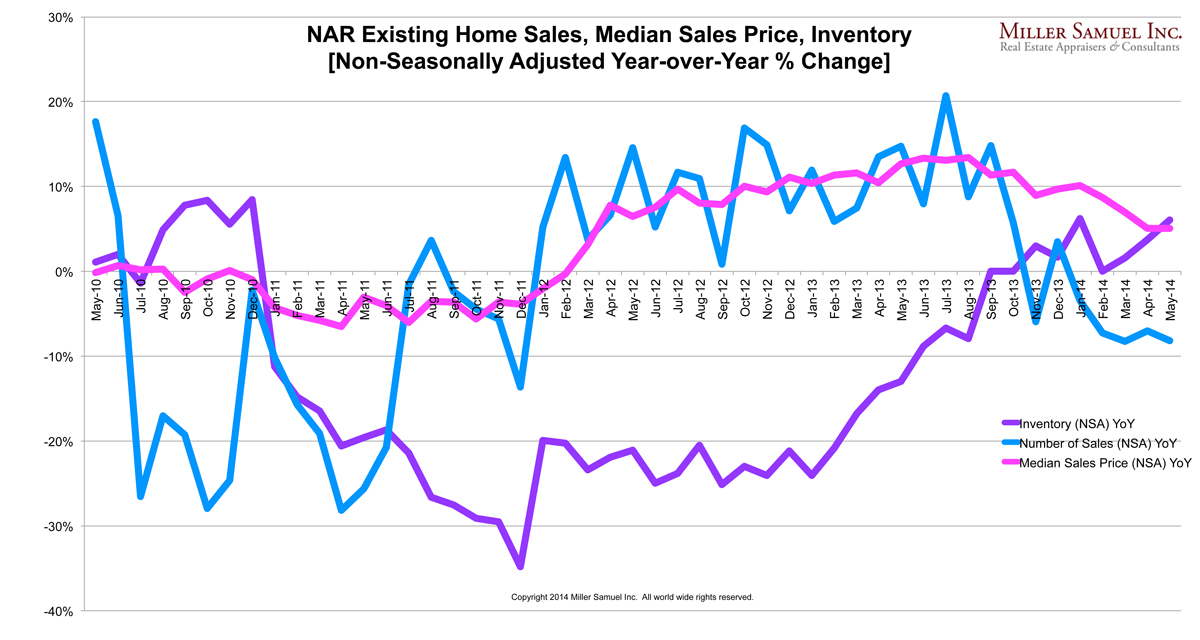
My two big rules: ignore seasonal adjustments and focus on year-over-year results. The consumer doesn’t know that the EHS report results are heavily adjusted rather than providing the actual results.
Since the annual sales figure is a multiplier of a monthly figure, why do we need to alter the actual numbers any more by adjusting for seasonality? Through recent periods like the possible expiration of the Bush tax cuts (end of 2010), the federal homeowners tax credit for new buyers and existing home buyers as well as the expiration of the fiscal cliff at the end of 2012, seasonal adjustments are subject to maddening skew.
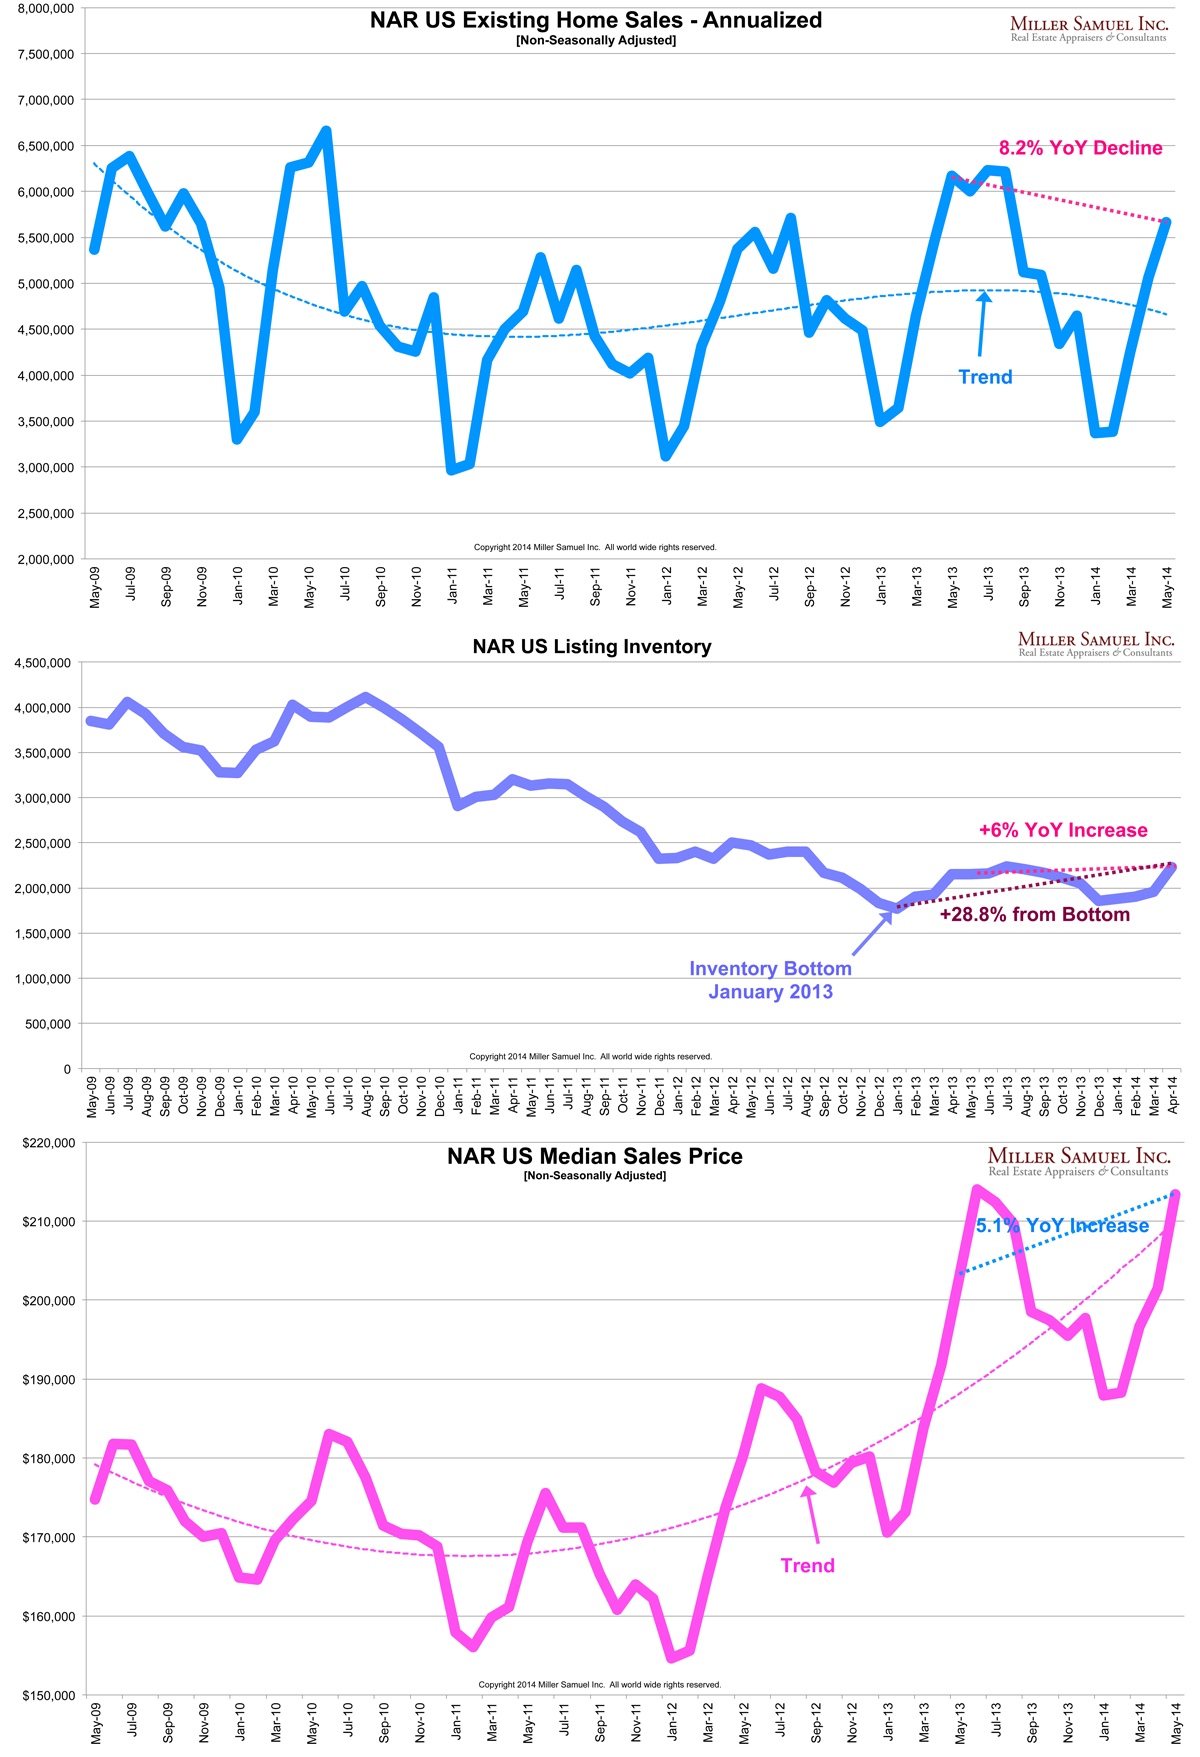
For much of 2013, median sales price was rising at an annual rate of more than 10%…
– It’s good to see the pace of the market returning to more sustainable conditions – last year’s market was not normal with rapid price growth and tight supply.
– Now we are seeing inventory return to the market and rate of price growth is easing. Both are good news.
– Mortgage rates have slipped but still not to the lows of early 2013. Falling rates not helping sales rise because last year was a release of years of pent-up demand.
– First time buyers are still not as active as they need to be, with their share down to 27% from 29%. Typically they shold account for at least 1/3 of the market. Tight credit and tough job market are reasons (not a lifestyle changes).