 ,br>[click to open RealtyTrac Report]
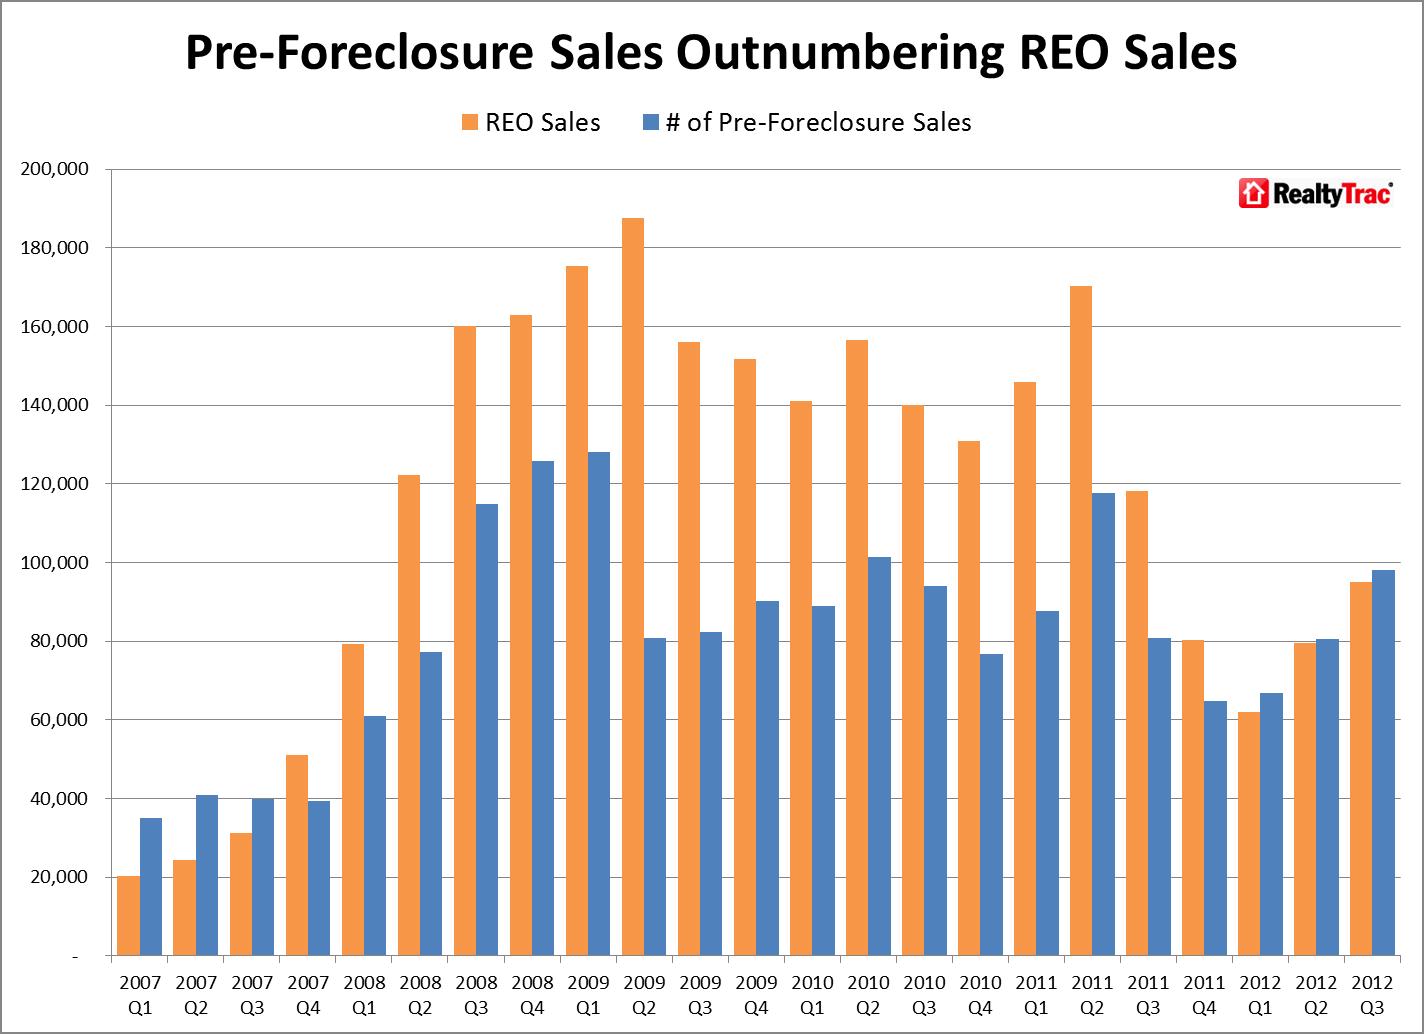
RealtyTrac released their Q3 2012 U.S. Foreclosure & Short Sales Report which shows a pretty clear recent trend:
A timeline that counters the national “recovery” discussion over the past year. Record low mortgage rates and held back distressed activity goosed housing sales and price up using year over year comparisons.
I feel like I have to qualify myself as NOT being a housing bear (a distressed housing apologist) but I still can’t figure out the math: flat to falling incomes, high unemployment, rising taxes and tight credit = housing recovery? What’s missing? (memories of my contrarian sentiment feels the same as 2006, just not nearly so dire).
Distressed sales have been held out of the mix as RealtyTrac’s report shows in my distressed housing timeline:
* 2008-2010 – Heavy foreclosure volume as a result of the fallout from the tanking economy and housing market
* 2010 (fall) – Robo-signing scandal combined with huge backlogs in judicial states causes a sharp decline in distressed sales entering the market in 2011.
* 2012 (1Q) Major servicer agreement with state attorneys general as distressed volume drops to its lowest crisis level.
* 2012 Calculated Risk and other respected sources call the bottom (and they may be right) but doesn’t factor in the distressed sale phenomenon. “Bottom” does not equal “recovery” but rather it’s a step on the way to recovery.
* 2012 (2Q) Distressed sales begin to rise again. By adding lower priced distressed sales in the mix, housing prices stabilize or slip next year nationally (I see Manhattan rising with low distressed exposure and limited inventory).
Foreclosure levels need to resume their elevated levels or we simply don’t create a real, sustainable housing market recovery. We won’t see a tsunami like 2010 as short sales continue at their high levels and the courts are still backlogged, but I believe we will see a more distressed activity in the next few years than we did during the 2012 lull and that will offset rising prices .
Call me crazy.
_____________________
Q3 2012 U.S. Foreclosure & Short Sales Report [RealtyTrac]
13 Comments
Comments are closed.


I am with you on this – the data looks like there has been some price support related to artificially depressed levels of distressed inventory. Will investors take quick gains and get back in the mix once prices start to dip again due to higher supply? Or will they sit back and wait a bit? I guess it depends on how strong their current return (rental yield) is relative to other income investments.
I suspect their yields will slip as pricing for distressed edge higher.
Always pays to research several areas in the market to get the best up to date property news. Your Blog is a great source of information. Thanks Jonathan
Great post Jonathan.
From the trenches, In the past 18 months i have handled many more “short-sales” with lenders. The owners haven’t made payment in a year or two but the lender hasn’t foreclosed. So is it a short-sale or a foreclosure in the market data?
They are each represented separately on the chart. My point is that they are both considered distress and their lower level of volume has skewed the overall price levels higher. Foreclosure generally sees a much larger discount than a short sale so a market share increase of either/both will provide a drag on aggregate pricing. The fact that more short sales are in the mix than the pre-2010 trend would have predicted means a lower drag on aggregate pricing going forward and that’s a good thing.
[…] Source: Miller Samuel Inc. […]
Lenders are attempting to get short-sale prices vs. foreclosed prices. Might work except lenders still take 4 times longer than owner occupied to close a short-sale so buyers avoid them, thus longer market time , thus lower sales price.
Most important indication on the chart is that distressed property sales have increased each of the last 3 quarters. Increasing even when, seasonly, sales decline.
Bingo – thanks for your insights!
[…] Foreclosures Needed Posted on December 10, 2012 by Jim Duncan Seriously. Hi there! Since you're new, you may want to subscribe to my RSS feed or sign up for Email Updates. […]
[…] 2012 has been an interesting year for real estate on a number of fronts, but this this chart from RealtyTrac sums up what I would consider the current state of the U.S. housing market pretty well. If you can spot the recovery here on this chart, please let me know. I’m not quite sure how falling incomes, high unemployment, rising taxes and tight mortgage credit equate to a housing recovery. The latest data from RealtyTrac suggest I’m not alone in my skepticism. […]
[…] Miller, President and CEO of the real estate appraisal and consulting firm Miller Samuel, Inc., astutely asks the question of how home prices can rise in an environment where unemployment remains high, there […]
[…] Ignore The False Positives, Foreclosure Sales Are Rising Again Now […]