
Often one of the problems with national or local housing statistics, as diseminated in press releases from real estate trade groups and companies, and the media, is how often the numbers are presented incompletely or out of context or with plenty of spin, often unintentionally. While the article is not specific to real estate, Carl Bialik’s The Numbers Guy column explores this phenomenon in [Monitoring the Numbers in the News [WSJ].](http://online.wsj.com/public/article/numbers_guy.html?mod=djemnumbers)
“For 10 years, Richard Holden has been monitoring bungled numbers in news reports and teaching journalists to be more vigilant.
Mr. Holden was a longtime editor at The Wall Street Journal and now works as executive director of the Dow Jones Newspaper Fund, an educational foundation funded by Journal parent Dow Jones & Co. Several years ago, he started gathering examples of poorly presented numbers from newspapers (including the Journal). One article said a baseball manager was seeking his 1,000th career victory this season — but didn’t specify how many he’d amassed so far. Another article reported that certain salaries were doubled from $200,000 to $500,000.
…Mr. Holden focuses on numbers that probably are correct, but are poorly or mistakenly presented by newspapers…”
One of my favorite sports quotes was from superstar basketball player Jason Kidd when he was drafted by the NBA Dallas Mavericks before he was traded to the NJ Nets. He said something to the effect of: “We’ve got to turn this team around 360 degrees.” Most knew what he meant, but it meant literally nothing.
One thing I have learned and was backed up in a class I took presented by [Edward Zufte](http://www.edwardtufte.com/tufte/), the zen-god of presenting information. His books include Envisioning Information and make the point that any chart or table without a source or identification of the scope of the data set (I’m interpreting here) “is a lie.” Within real estate, the public has grown to be wary of spin and amateur use of statistics which is strange since the industry is oozing with numbers. Only firms that resist the urge to spin with almost reckless abandon, will be taken seriously.
Here are a few examples in a long list of misrepresented housing statistics:
* Housing prices have increased 10% to $500,000. 10% from when to when? Last month, last year?
* Market fell 10%: Celebrity XX couldn’t sell so she was forced to dump the property for 10% less than list price. Implication is that the market fell 10% when actually the market was rising during the marketing period and the house was simply overpriced.
* List prices in the county fell 10% this month. Implies the market is falling when list prices could have simply risen faster than the market. And of course, fell 10% from when?
* Prices of McMansions increased a whopping 300% since last year. Well, thats possible but since this data was based on 5 sales, its hardly credible. This happens more often than you think.
* The x-axis or y-axis of a chart are manipulated to smooth or increase the effect. Here are two examples using the same data. Only the scale on the y-axis was changed:
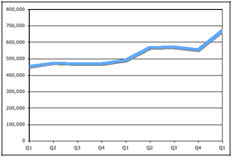
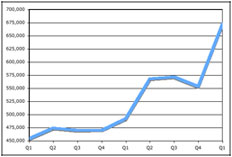
Which real estate market is better?