_Getting Graphic is a semi-sort-of-irregular collection of our favorite BIG real estate-related chart(s)._
Barry Ritholz’s [Chart of the Week: Yield Curve, 2002 versus 2006 [Big Picture]](http://bigpicture.typepad.com/comments/2006/04/chart_of_the_we_1.html)
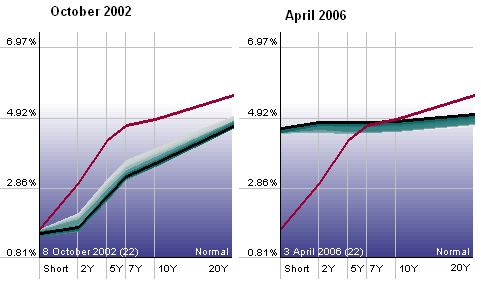
* 2002 — Steep curve with low short term yields
* 2004 — Fed starts raising short-term rates
* 2005 — Yield curve inverts briefly
* 2006 — Yield curve flattens as long term rates begin to respond to short term rate increases amid inflation concerns
Its going to get interesting when and if the economy gets dragged down by lower activity and prices in the housing market. In theory, the fed could be forced to drop rates in 2007 if the economic reaction to a weakening housing market is harsh. There remains a lot of conjecture that an inverted yield curve leads to a Recession. However, at least to this point, that does not seem to be the case this go ’round.