Peter Coy in his post [Big Drop in New-Home Sales [Hot Property]](http://www.businessweek.com/the_thread/hotproperty/archives/2006/03/big_drop_in_new.html?campaign_id=rss_blog_hotproperty) says:
>Don’t blame it on the big snowstorm that hit the Northeast, giving New York’s Central Park a record snowfall: sales actually rose in the Northeast. (over prior month, not prior year -ed)
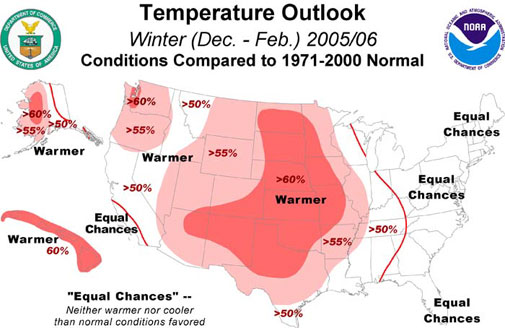
[Census Bureau: New Residential Sales In February 2006 [pdf]](http://www.census.gov/const/newressales.pdf)Existing home sales positive results were explained by unusually mild winter weather, why doesn’t this apply to new home sales?
New home sales fell further than expected an inventory levels are higher than any time in the past 10 years. _The median sales price dropped to $230,400 from $237,300 a year ago. The seasonally adjusted estimate of new houses for sale at the end of the month was 548,000, representing 6.3 months of supply at the current sales rate, [the highest month’s supply number in 10 years. [TheStreet.com]](http://www.thestreet.com/_tscs/markets/realestate/10275554.html)_
Here we have another month with the 1-2 punch. Existing home sales are released the day before new home sales and more often than not, the results are not in sync. The surge in existing home sales is attributable to the unusually warm weather in January. Yet new home sales for February were down.
Why have the results been so different?
The market is changing. NAR’s existing home sales lag because they are based on closed sales. New home sales stats by the Census Bureau are supposedly current because they represent new contracts and we should see new home sales as a more reliable indicator. Right?
Here are some problems with this logic.
* New home sales represent a small fraction of existing home sales (1M versus 7M) so they can be more volatile.
* New home sales are more heavily weighted with focus on higher end construction and that is currently one of the weaker market segments. The February existing home sale median sales price was $209,000 and the new home median sales price was $230,400, a 10.2% spread.
So which is the better indicator? _Really, neither is better._ But they are the best we have at the moment. I try not to get too worked up about either indicator when they are released.
One other thought. The coverage and the press releases focus on the the seasonally adjusted and annualized results rather than actual.
I don’t mean to sound cycnical but I guess thats sort of like a real estate broker on the day of a huge closing/commission. $$$ x 5 days x 52 weeks = Annual Commissions. Perhaps thats the problem.
_I’d love to see more analysis with the raw numbers._
[February Existing Housing Under High Pressure (And Partly Sunny) [Matrix]](http://matrix.millersamuelv2.wpenginepowered.com/?p=500)One Comment
Comments are closed.


Indicators and average’s can be as much fun as they can be misleading. According to the latest Corc Report the average price of a Co-op is 998K. A frightening figure for the average buyer. But most sales are studios and one bedrooms, say 300k to 600k. It is of course the higher priced apartments that skew the average.
I see a similar kind of misinformation in the New Home Sales data. I love the numbers and stats too but nothing beats day to day market watching and checking with different sources and authorities.
Now If only I can assemble these various and conflicting reports and explain to my buyer why his imminent purchase of a new development is going to cost less (isn’t that a good thing?) now then last December.