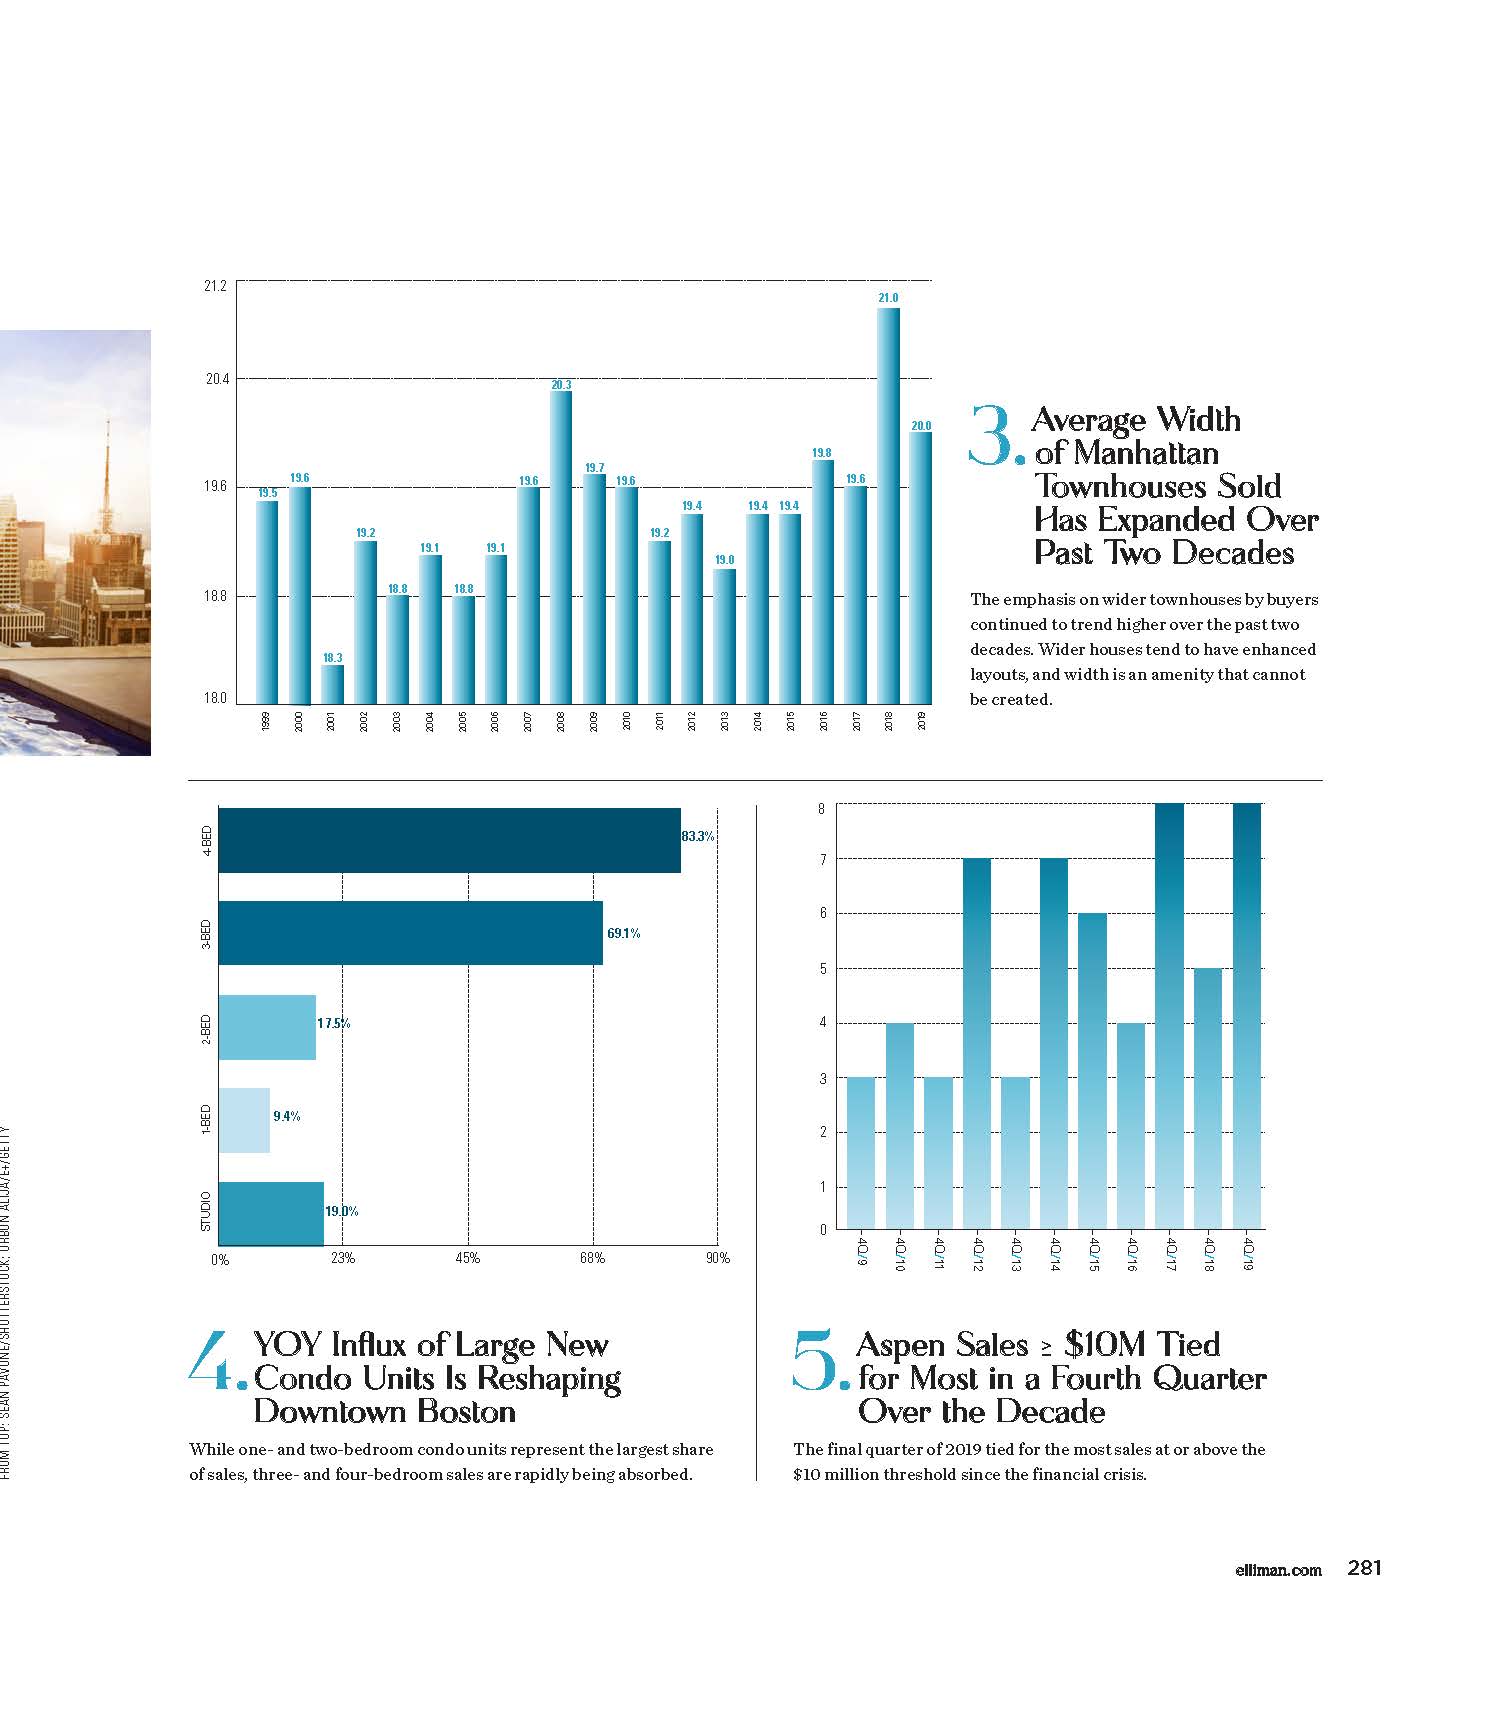
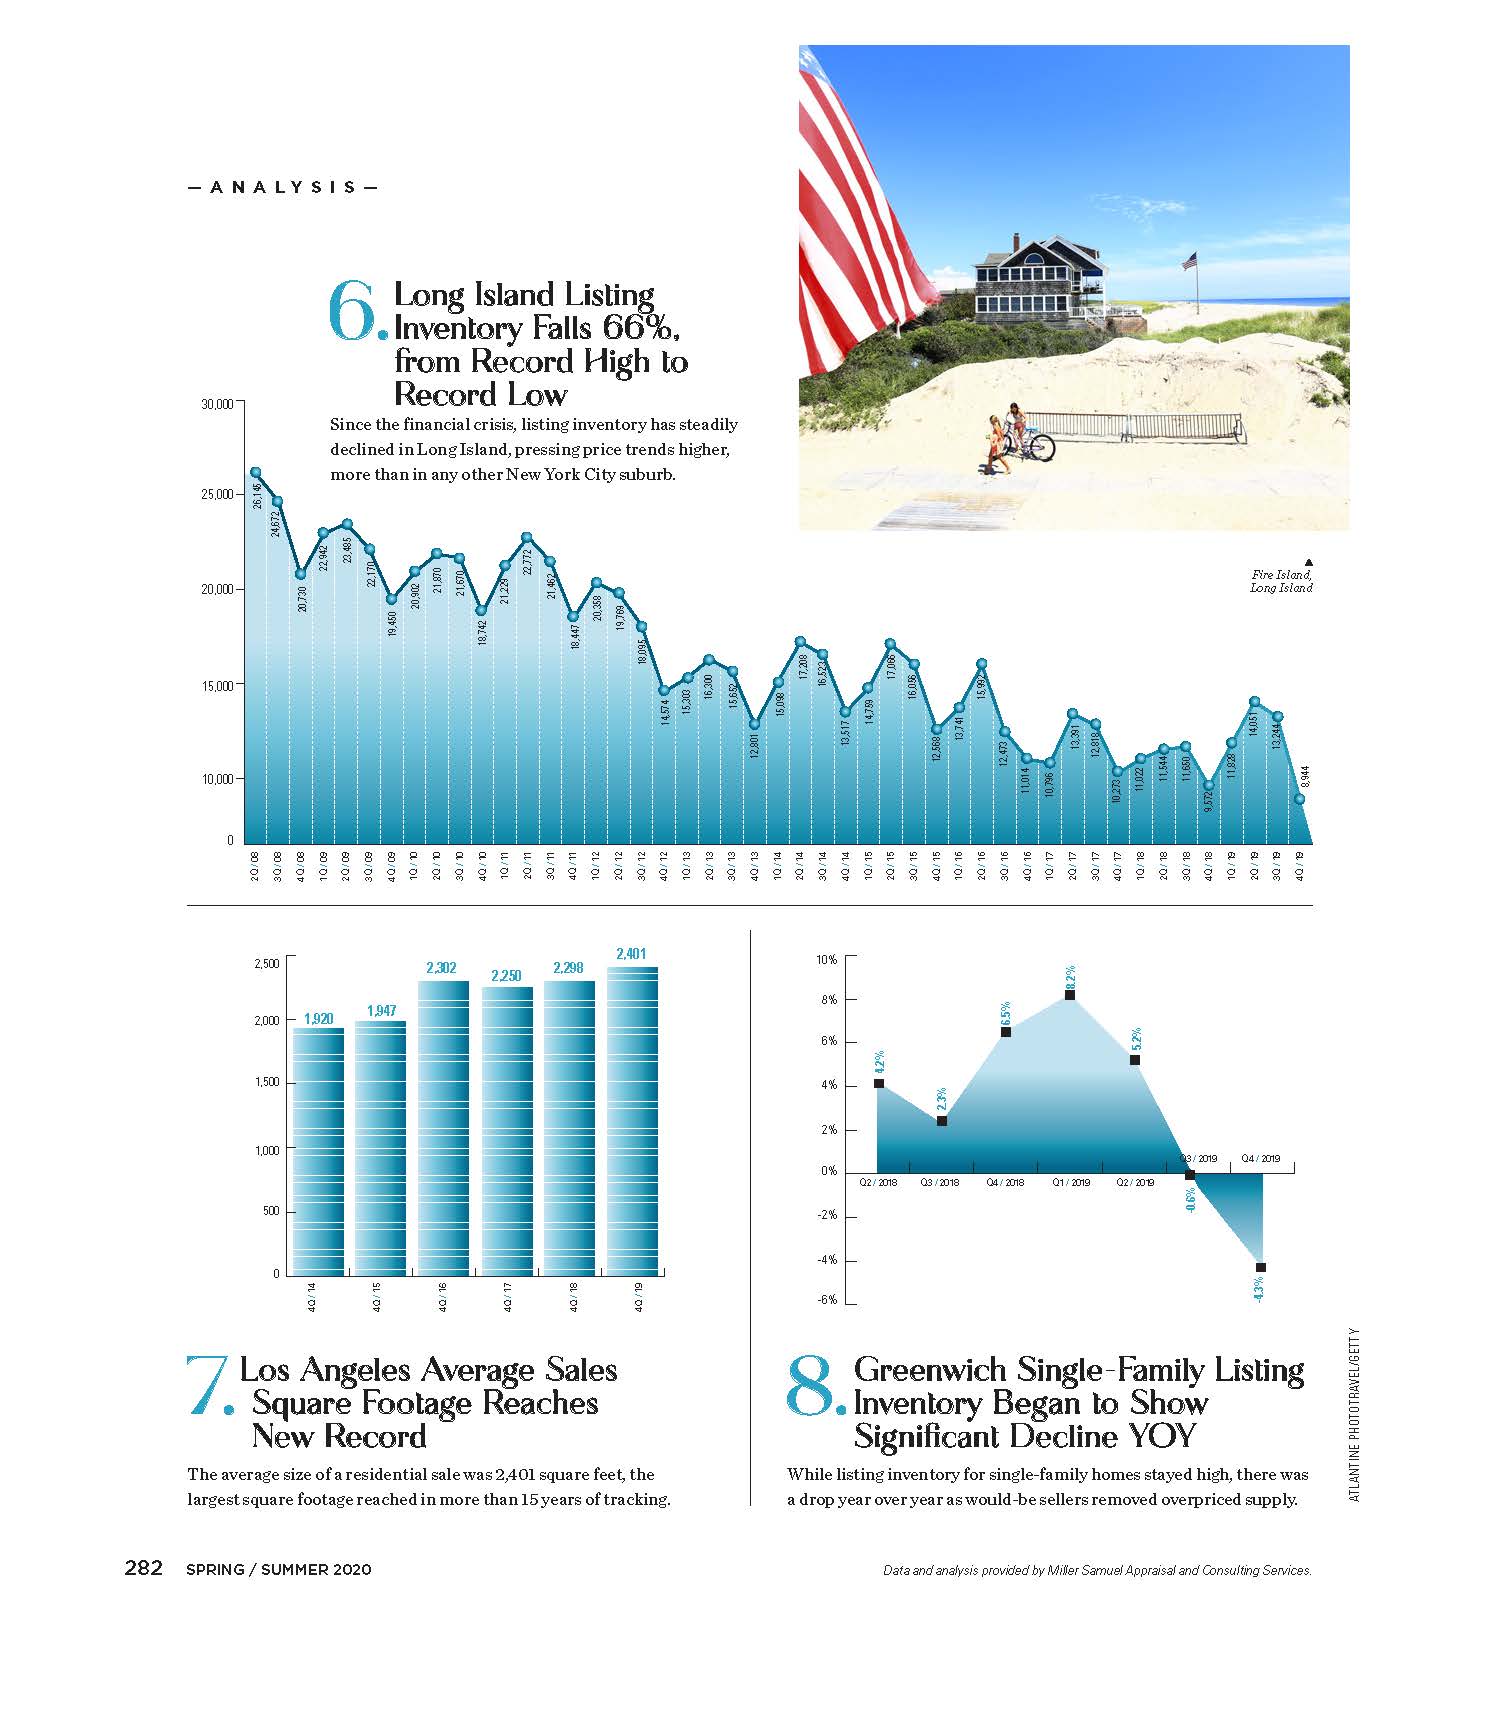
I whipped up eight charts using data from our expanding Douglas Elliman Market Report Series to touch base on a wide array of U.S. housing markets. These charts appeared on pages 280-282 in the 2020 Spring/Summer edition of Elliman Magazine. Click on each graphic to expand.