Skip to content
Services
Appraisals
Consulting
Resources
Market Reports
Charts
Matrix Blog
Articles & Research
Press
About
get in touch
Charts
› New York City
September 11, 2025
Manhattan Doorman/Non-Doorman Median Rent YoY% vs. Freddie Mac 30-Fixed Mortgage Rate
read more
September 11, 2025
Manhattan Landlord Concession Market Share
read more
September 11, 2025
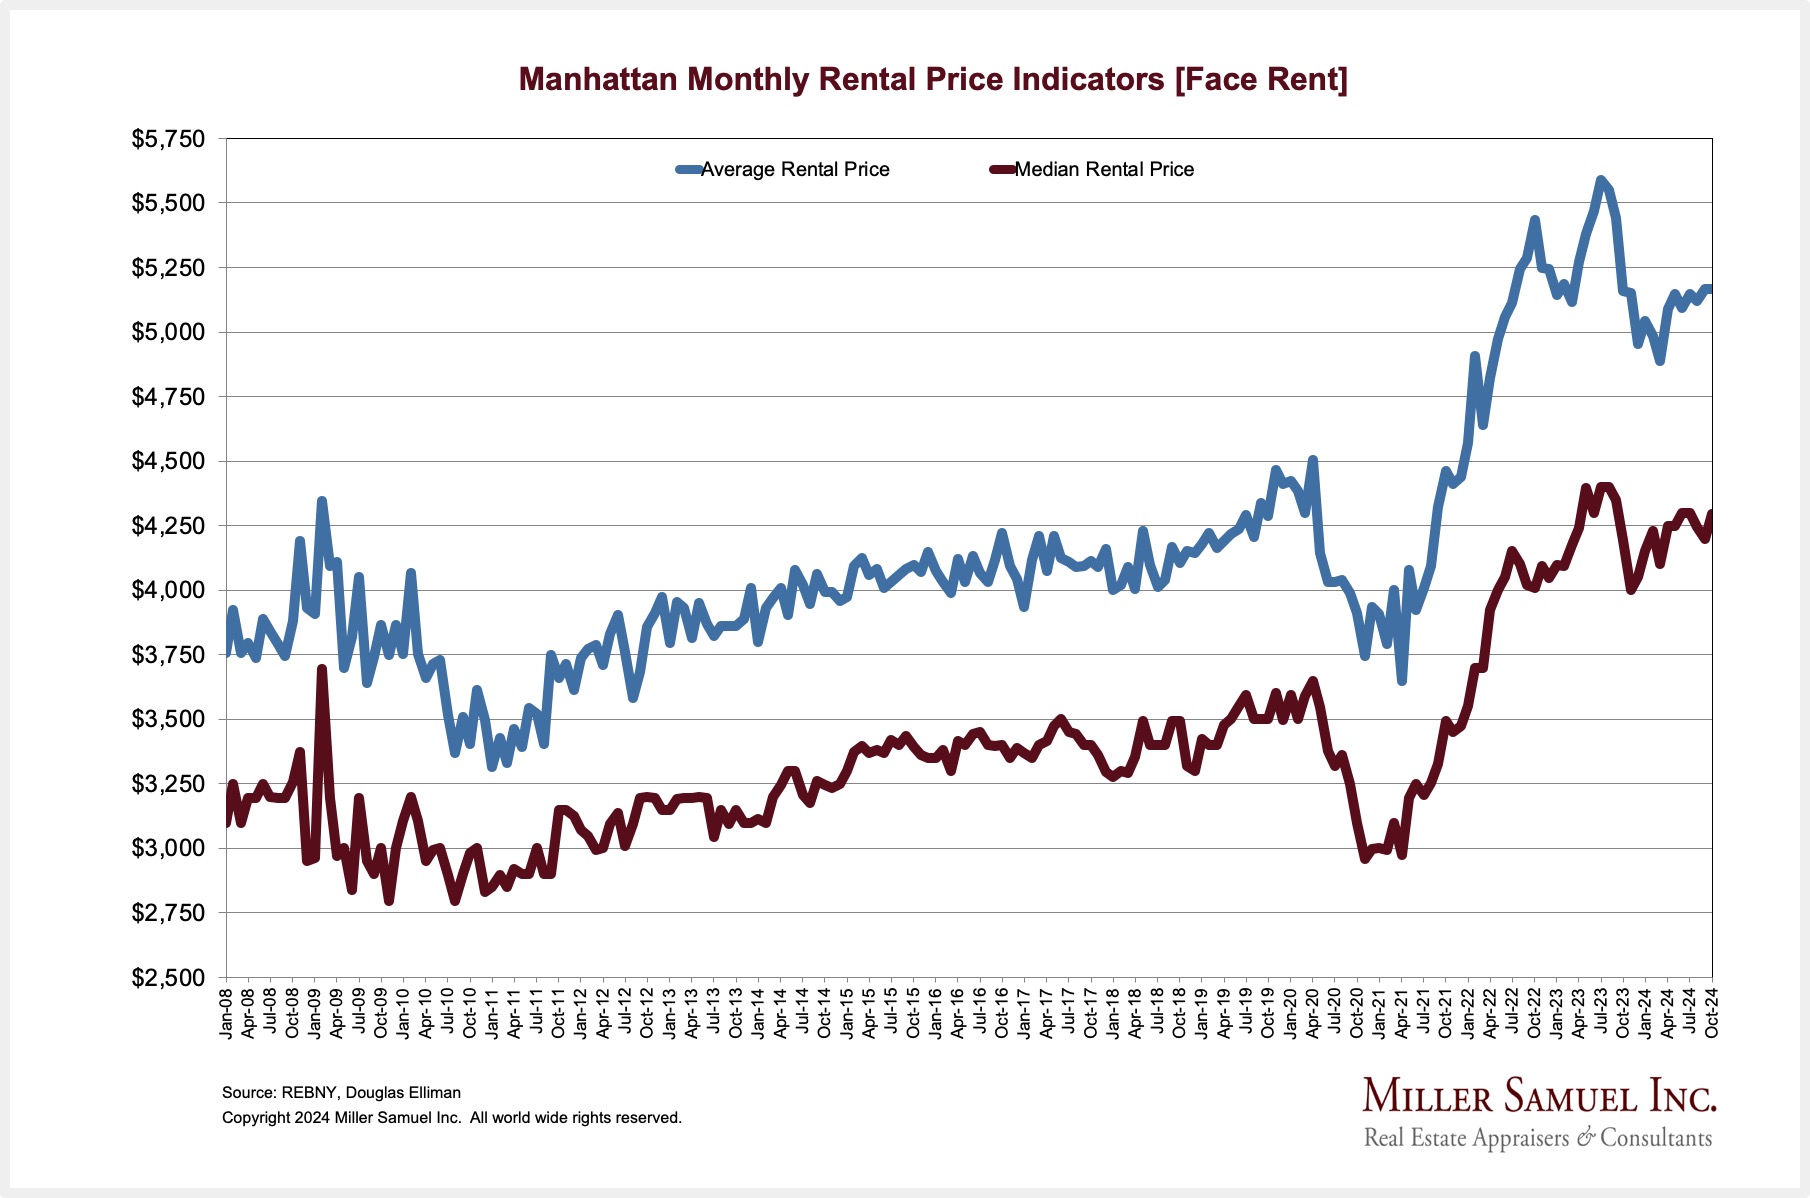
Manhattan Monthly Rental Price Indicators [Face Rent]
read more
September 11, 2025
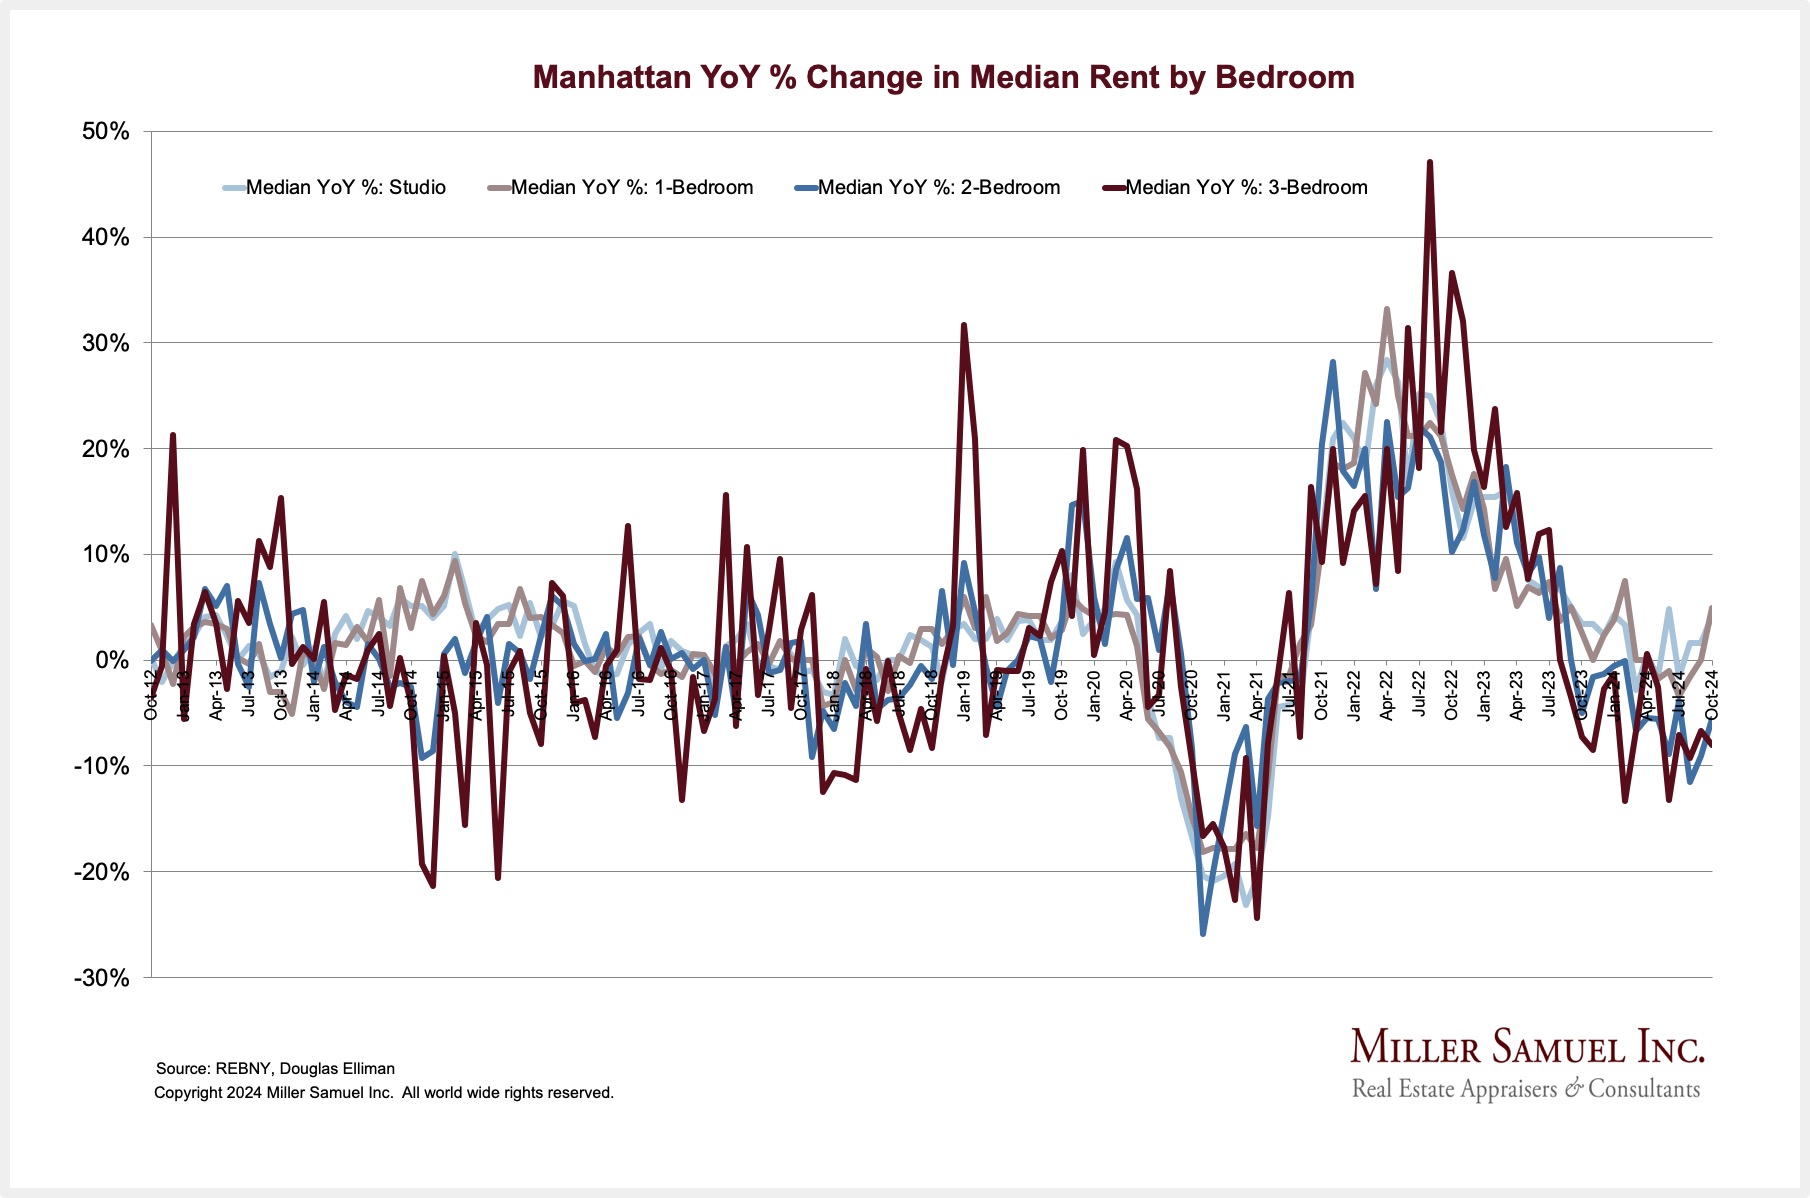
Manhattan YoY % Change in Median Rent by Bedroom
read more
September 11, 2025
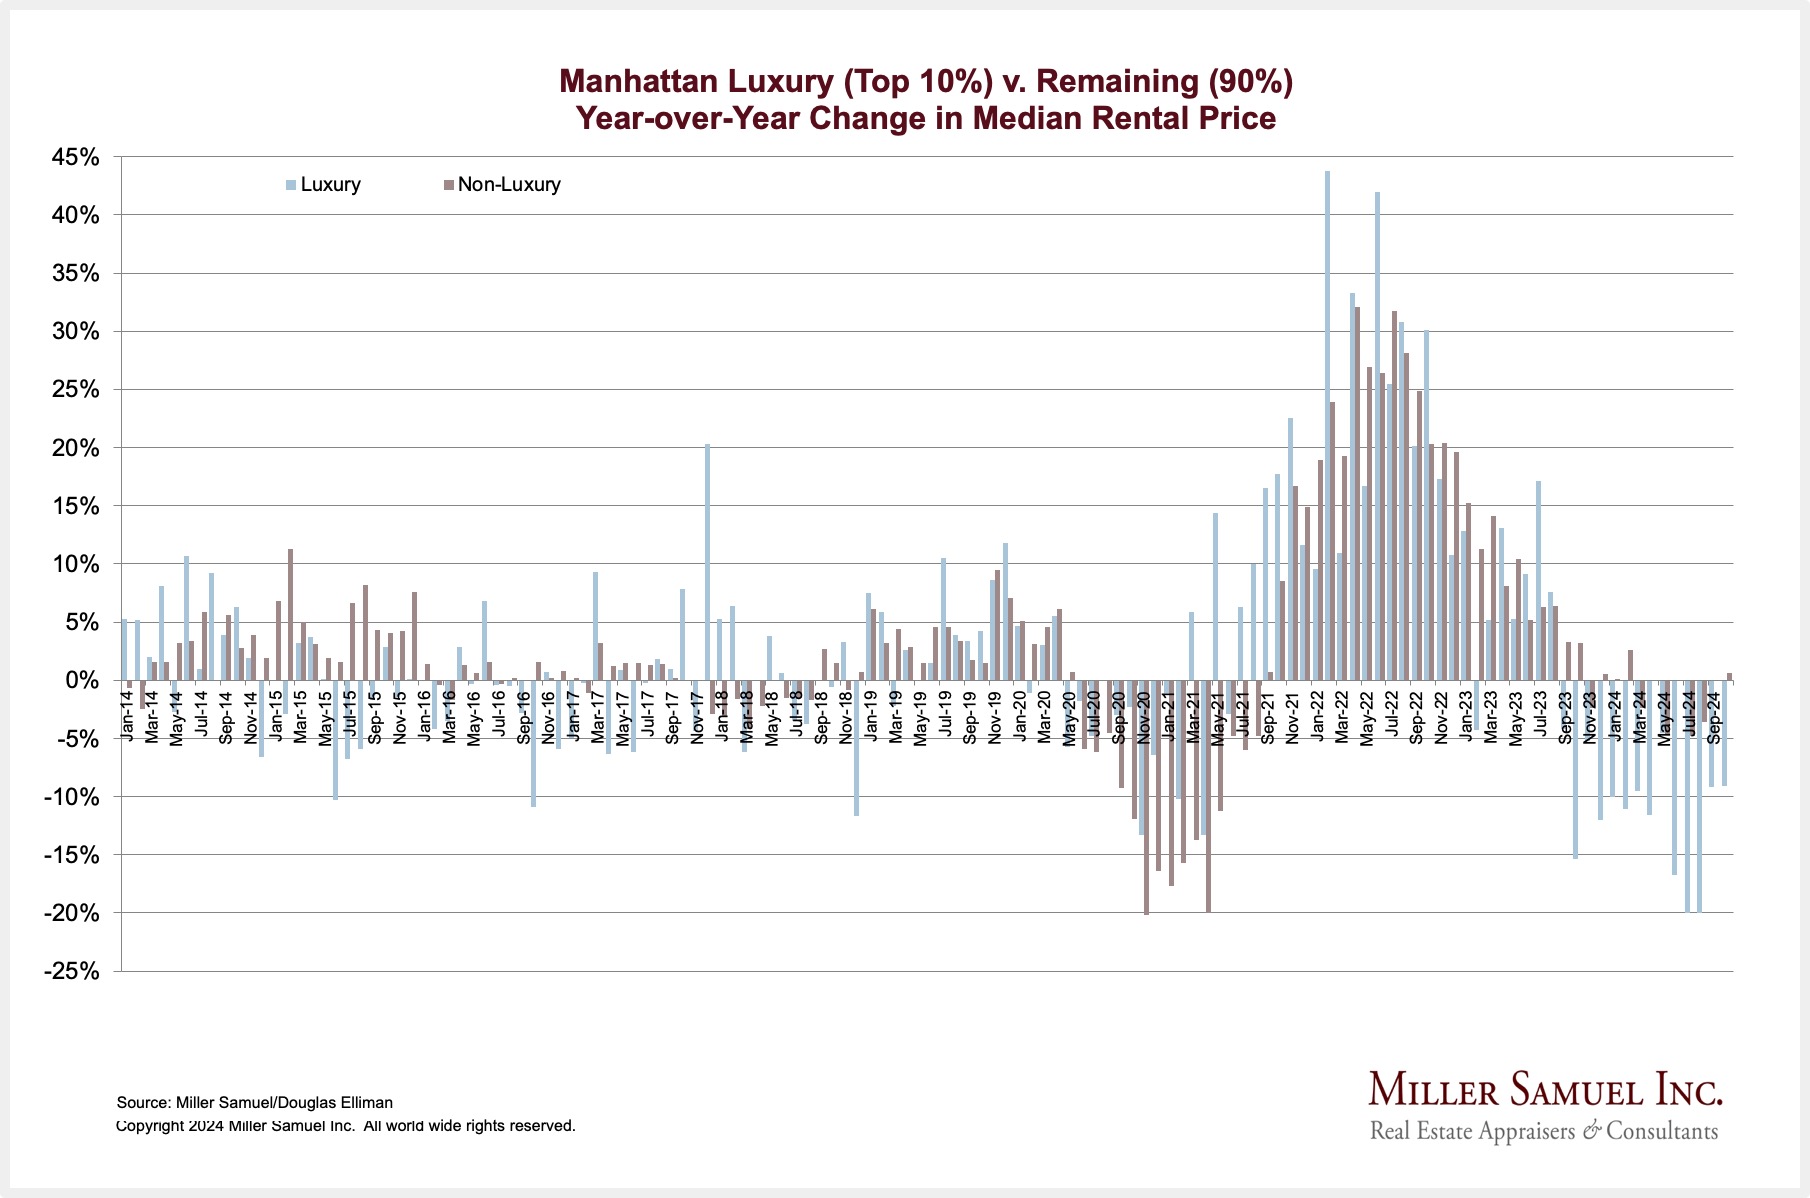
Manhattan Luxury (Top 10%) v. Remaining (90%) Year-over-Year Change in Median Rental Price
read more
September 10, 2025
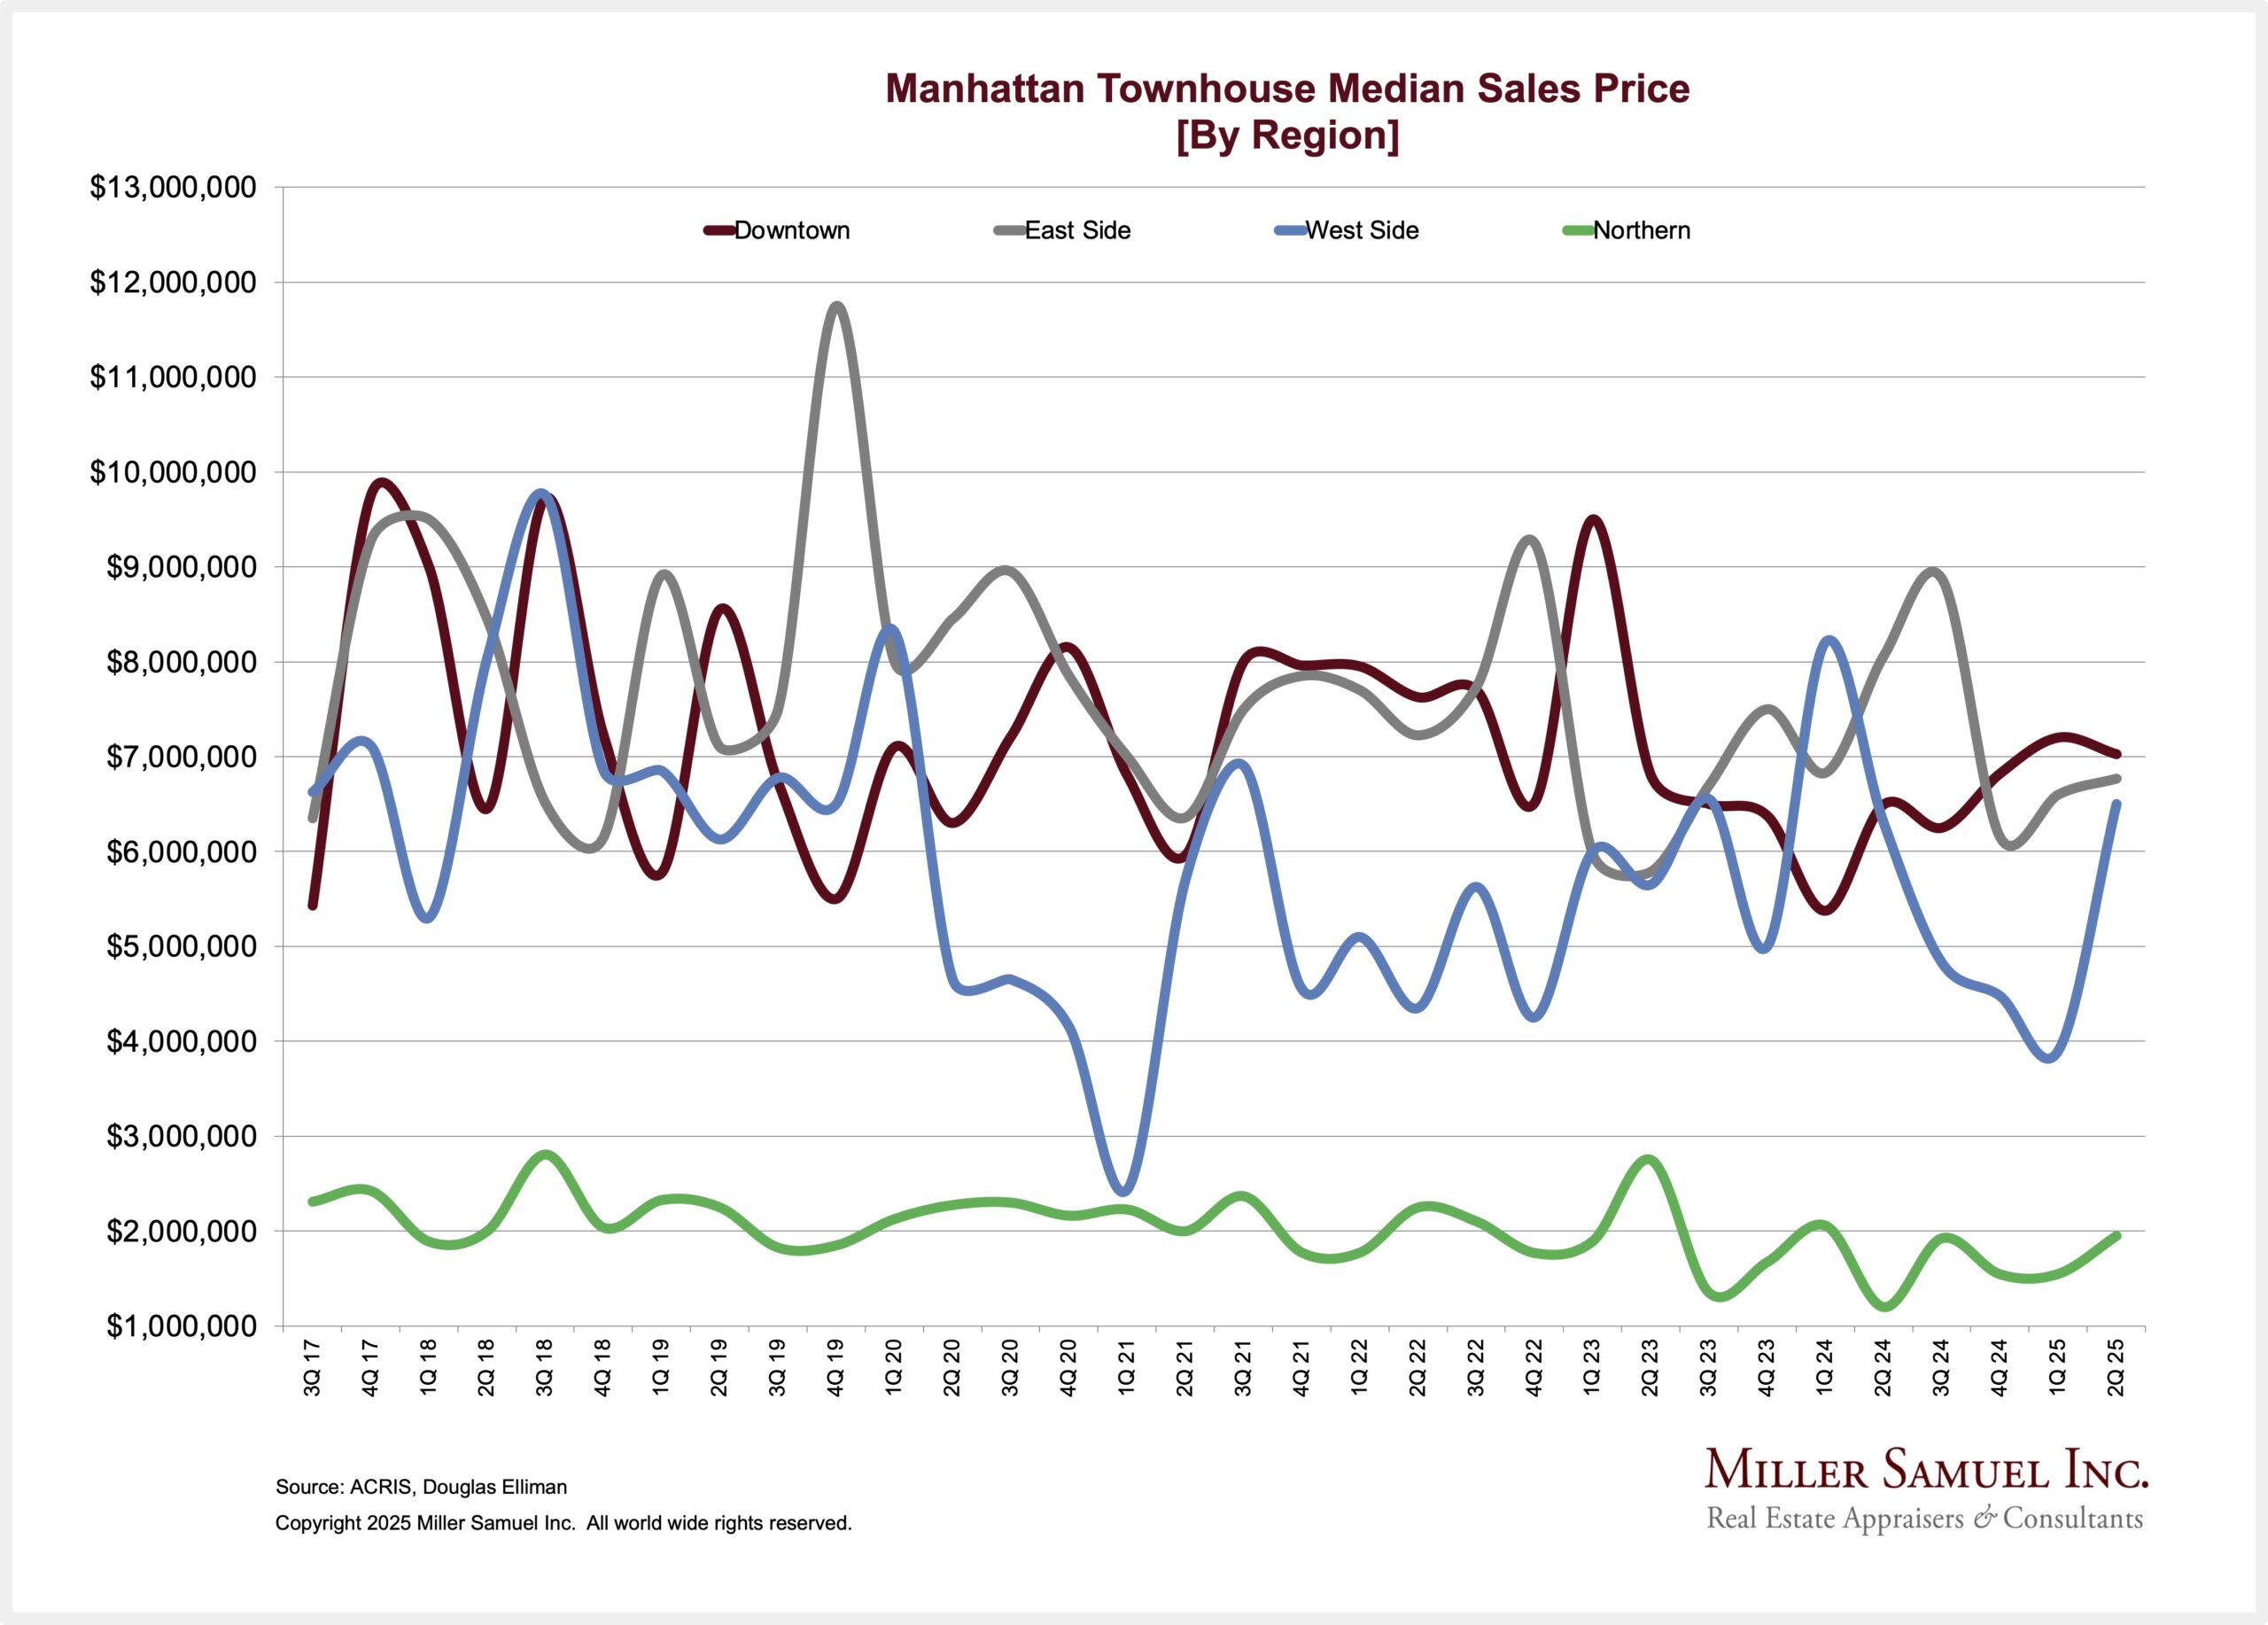
Manhattan Townhouse Median Sales Price [By Region]
read more
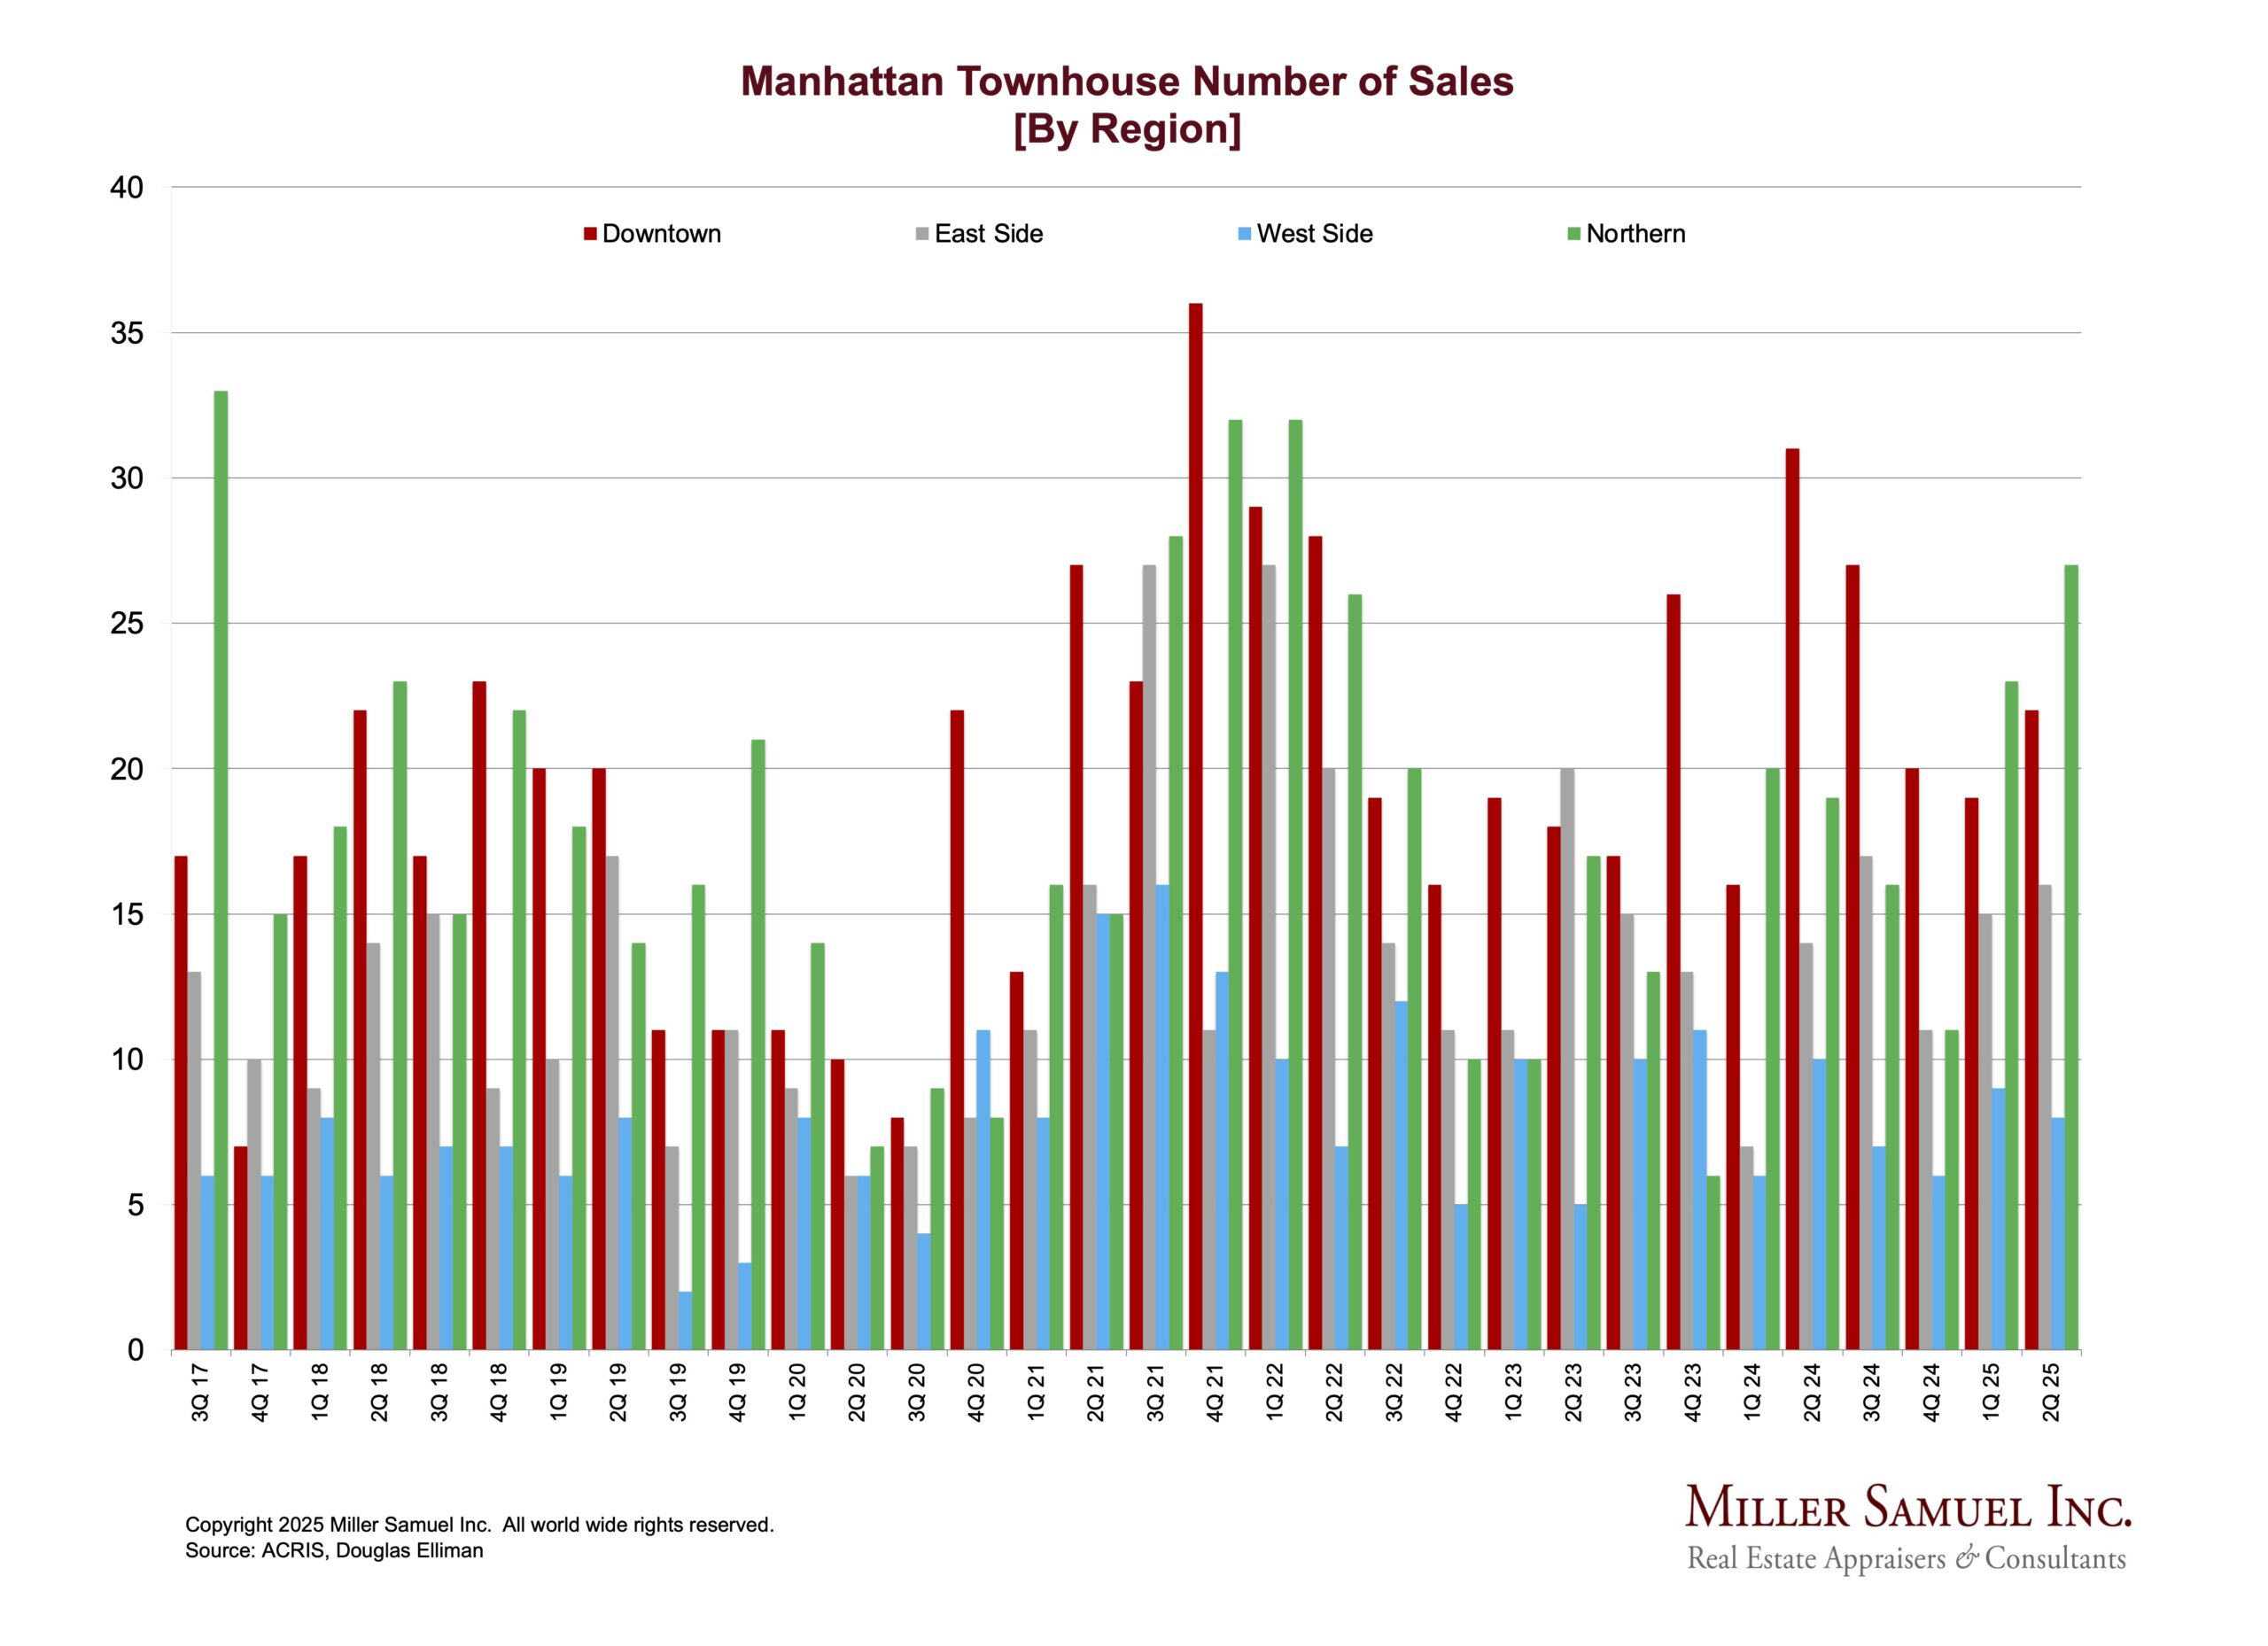
September 10, 2025
Manhattan Townhouse Number of Sales [By Region]
read more
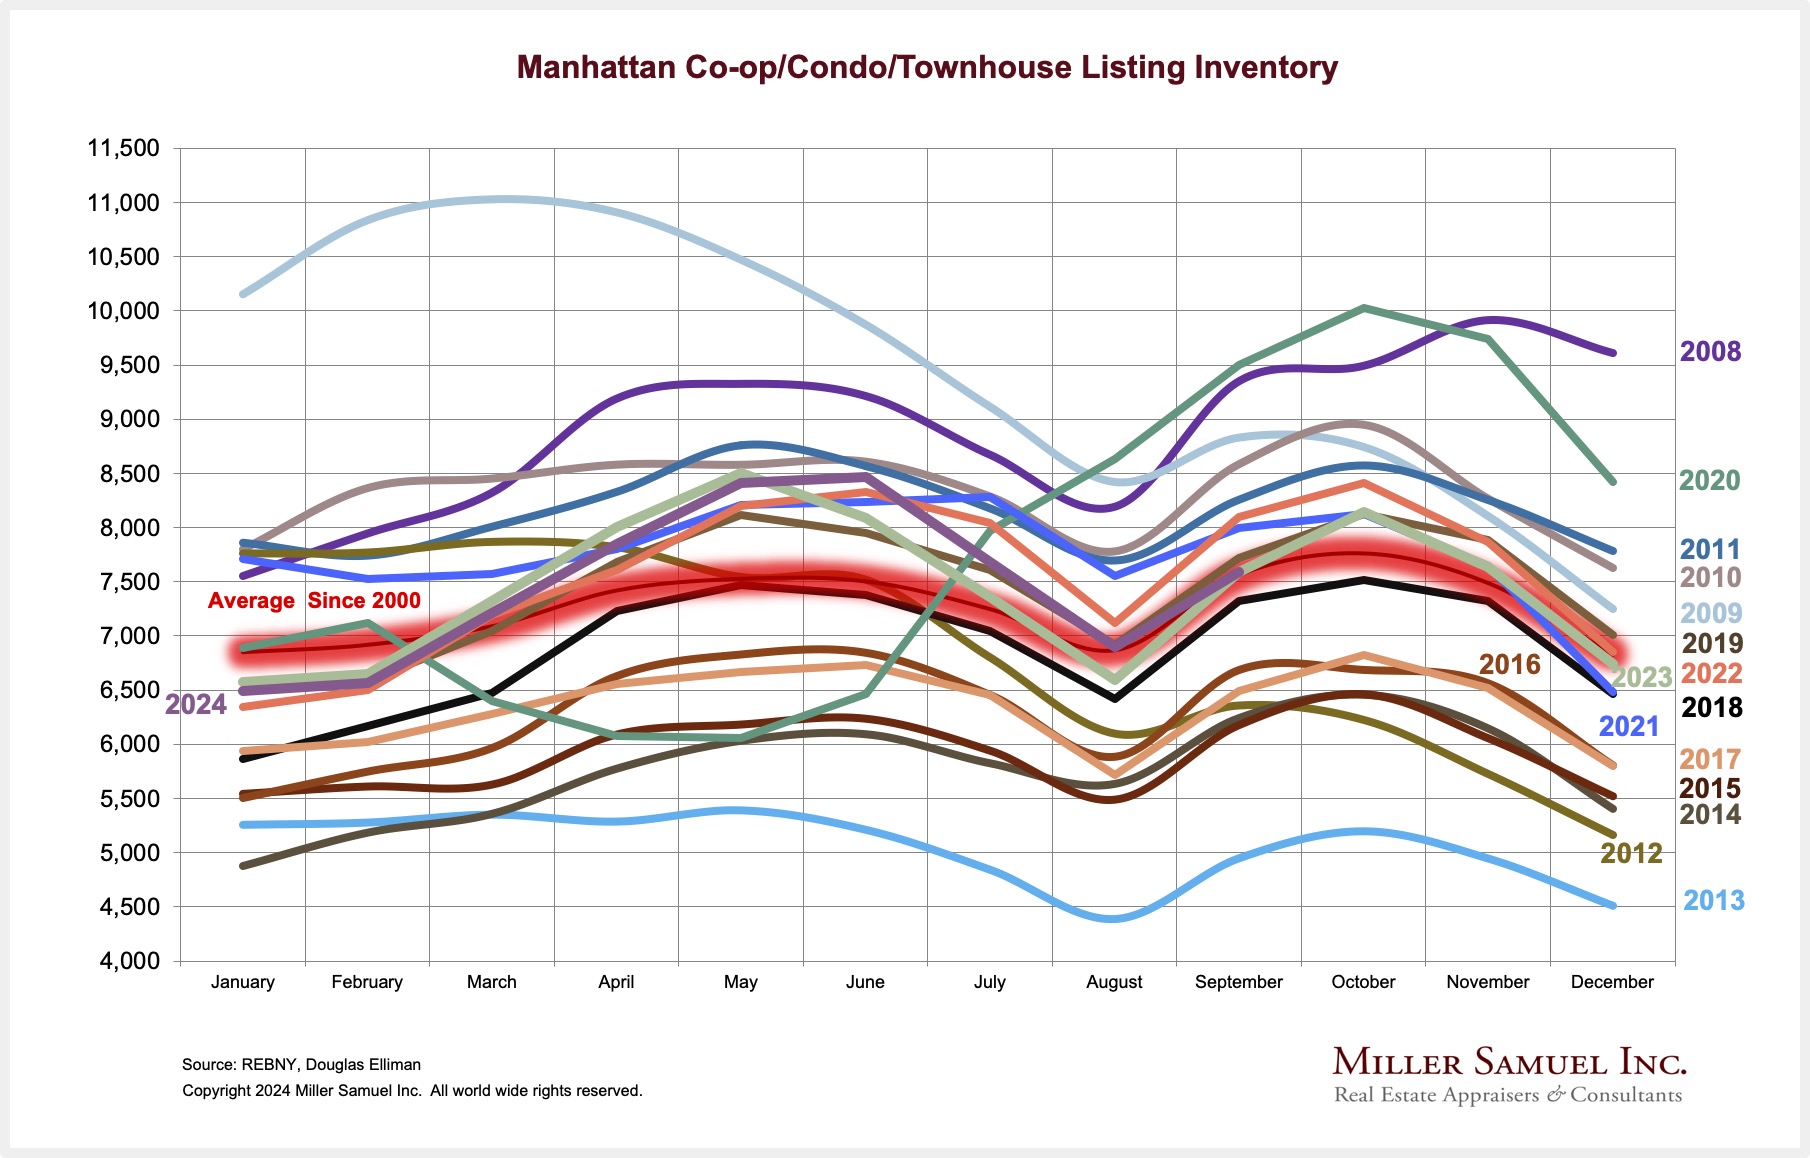
July 2, 2025
Manhattan Co-op/Condo/Townhouse Listing Inventory
read more
July 1, 2025
6-2025: Manhattan Months of Supply by Price
read more
May 15, 2025
4-2025: Manhattan Months of Supply by Price
read more
April 2, 2025
Manhattan Market Share Of Cash v. Financed Sales
read more
April 2, 2025
Manhattan Co-op & Condo Listing Inventory – YoY % Change
read more
Previous
1
2
3
Next
Load More Charts
Page load link
Go to Top