Brownstoner, which is the go to resource on all things Brooklyn has a regular appraisal feature which I’ve meant to comment on. They feature an active property listing whether its a co-op, condo or brownstone and ask for readers to estimate the value of the property.
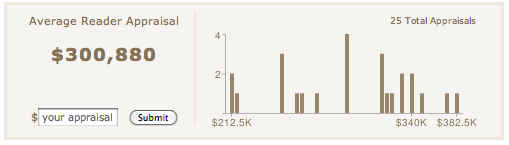
Most posts seem to garner 20-30 “appraisals” which is summarized in a chart.
Today the featured “Co-op of the Day” was 96 Schermerhorn Street, #7G
 [click to open post]
While they might consider changing their use of the word “appraisal” to something else like “opinion”. But frankly, with the crap being passed off as bank appraisals these days, I am pretty confident the reader won’t need to tell the difference.
The reader comments are both entertaining (hilarious) and informative at the same time. Whats intriguing about the chart itself is that it tells a good part of property valuation process appraisers go through. We have to deal with outliers, both high and low, that when relied on exclusively, don’t often reflect a reasonable value estimate.
The data is inherently different though – while this is a compilation of opinions on the property, the data points don’t represent sales transactions, each of which would have had a “meeting of the minds” and made it all the way to a closing usually via mortgage financing.
Of course, the results can also be skewed by the particular perspective of the participants for each property: renters, owners, brokers, etc. and someone could try to game the results, but the outliers tend to offset each other. The “appraisals” on the blog appear to be consistently averaging 10% to 20% below ask over the past month. This particular property was “appraised” at 12% below ask.
According to our market reports, the average listing discount for the past 2 years has averaged 4.9% so unscientifically, this “appraisal” method hits the properties 2-3 times harder than the actual discount might show.
However, as long as the “appraisal” discounts remain consistent, it might have some reliability, but more likely, it provides an nuggets of insight and a lot of entertainment.
I’d like to think actual appraising is this entertaining.
5 Comments
Comments are closed.
The average prediction generated by the widget has been pretty consistently coming in at 10-15% below the ultimate sales price. I’ve been meaning to add a predictive price based on that, but it does make sense since you only need one buyer to meet a price, not the consensus of a group.
That’s a great point – I like the idea of consistency – to see if there is a general relationship between consensus and what the property actually sold for – not whether the price was correct, but whether there is a relationship in the spread between the two.
I’d love to see the results of “social media” valuation versus the patterns of actual buyers and sellers.
If you have an intern who wants to do the calculations, I can provide the historical data!
Send it over and sampling and I’ll take a look. If its something we can crunch, we’ll crunch.
Jon — this is actually fascinating. But I’d really like to see this developed as an actual trading market (like Intrade.com). Random opinions are somewhat meaningless, I think. Let people put real money on it and that should yield far more interesting results.
It’d be an interesting derivative, for sure. 🙂 It would also allow people to directly short micro-neighborhoods…
Gotta figure out the mechanics of this.
-rsh