United Van Lines has been publishing a report on [traffic patterns of the moves [United Van Lines]](http://www.unitedvanlines.com/mover/united-newsroom/press-releases/2006/2005-united-migration-study-01-06.htm) that are ordered within the moving company each year. This report has been published annually since 1977.
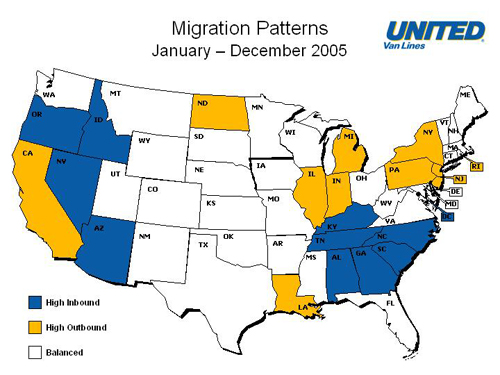
Methodology: “For 2005, the accounting is based on the 226,353 interstate household moves handled by United among the 48 contiguous states, as well as Washington, D.C. In its study, United classifies each state in one of three categories — “high inbound” (55% or more of moves going into a state); “high outbound” (55% or more of moves coming out of a state); or “balanced.” Although the majority of states were in the “balanced” category last year, several showed more substantial population shifts.”
Inbound
* While Florida (54.2%) has been inbound since the survey commenced, this year marked the lowest number of relocations to the state since 2000.
* Texas (53.9%) continued inbound movement since 1989 and saw slightly (1.3%) more people move in as compared to last year.
* As compared with 2004, Washington (53.4%) became the destination for 2.7% more residents.
Outbound
* California (55.7%) – 2005 marks the first time the state has seen a high outbound number since 1995.
* Louisiana (57.9%) – With many difficult challenges throughout the year, the state saw 4.5% more outgoing moves after being classified as a balanced state for the past four years.
* North Dakota (67.8%) – This year marked the highest outbound migration since 2001 for the state.
* Michigan (63.9%) – From the inception of the study, Michigan has been an outbound state.
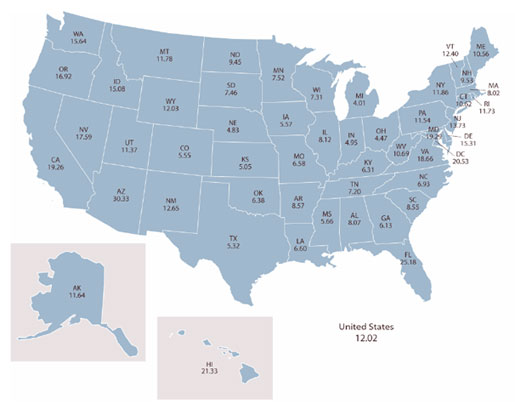
I thought it would be neat to try to correlate inbound and outbound traffic to housing demand. The idea that a state with high outbound traffic would have lower appreciation rates than states with higher inbound traffic. However, the census data does not fully correlate with this report. I can only assume that its a factor of the client demographic the moving company works with, or this is a flawed methodology.
Nevertheless, United Van Lines map concept is very cool.
US Census Division Map: Change in House Prices By Region
One Comment
Comments are closed.
You need a county by county break-down. For instance Illinois. The state is net out-immigration state. However the counties surrounding Chicago had significant inflows; I’d bet that the majority of the real estate appreciation for the state occurred there. Highly localized. (Of course city of Chicago lost population in the 2000-2004 time period, but still experienced appreciation, even in a couple of dodgy neighborhoods).