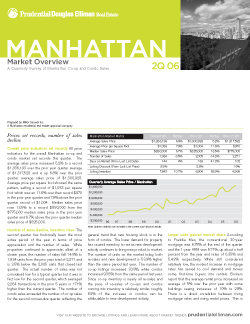
The PDF version of the [2Q 2006 Manhattan Market Overview [Miller Samuel]](https://millersamuel.com/reports/) that I write for [Prudential Douglas Elliman [PDE]](http://www.prudentialelliman.com) is available for download. I have been writing these market reports for them since 1994.
In addition, you can see the [methodology]) that went into the report including the [neighborhood boundaries](https://millersamuel.com/reports/neighborhood-boundaries-popup.shtml) and the [type of content](https://millersamuel.com/data/legend-popup.php) we have available.
You can also [build your own custom data tables](https://millersamuel.com/data) using the aggregate report data (from 1Q 89 through 2Q 2006).
_An excerpt_
…The phenomenon of rising prices and declining sales is a classic sign of a market in transition. The market has entered a period where the sellers no longer have a clear advantage in the typical sales transaction. Buyers were expecting a deep discount on all transactions while sellers remained fairly firm in their pricing. As a result, the number of sales dropped as the buyers who were resistant to rising prices simply chose not to participate, while those who stayed in the market paid record prices on average. The modest uptick in mortgage rates since the beginning of the year tempered demand as both existing and new development inventory was rising. While inventory levels are the highest they have been in ten years, the selection for buyers has not improved as much as the inventory numbers would suggest as sellers have not yet responded to the weaker demand. There is still a substantial portion of listings that are priced as if the market was seeing double-digit annual appreciation that occurred over the past several years. As a result, it is taking longer to sell an apartment and there is generally more negotiability…
Download report: [2Q 2006 Manhattan Market Overview [pdf]](https://millersamuel.com/reports/pdf-reports/PDE2Q06.pdf)
One Comment
Comments are closed.


Hmmmm … lots to chew on here, as per usual Mr. M. I will take one bite at the entry level data and one bite of lofts, please.
Interesting info about the market share and price decline in ‘entry level’ coops. I wonder if the difference in coop and condo performance in this segment offset each other (i.e., the 5% loss in small coop market share vs., the 7% increase in small condo market share). If so, the entry level buyers were not priced out of the market by higher interest rates (or anything else), but shifted to the easier to buy condo segment. Plausible??
I think this is at least the second quarter in a row in which the loft market has been stronger than the overall market (looking at number of transactions, inventory and days on market). I wonder if it is the resale part of the market or the new (condo) segment that accounts for this. Overall, new condos seem as hard to sell as any other type of apartment, so my question is how does the essentially flat YOY data for loft sales and loft inventory break down between coops and condos, or resales and new development. Certainly the loft neighborhoods of Tribeca, SoHo and Chelsea (principally) continue to have a large number of new condo developments.