[This market recap on the Northern Virginia from MLS data is compiled by [Butch Hicks](http://bhicks.com), a former president of [RAC (Relocation Appraisers and Consultants)](http://www.rac.net) (that I am a member of), a friend and an experienced appraiser in Northern Virginia. The results of his efforts are published on his web site as [a series of charts](http://www.bhicks.com/statistics.htm), each with a brief summary. (As a kid growing up in the Washington DC area, I was bombarded by “Virginia is for Lovers” tourism ads, and of course “DC is for US, by George”)] -Jonathan Miller
[View the charts [BHicks.com]](http://www.bhicks.com/statistics.htm)
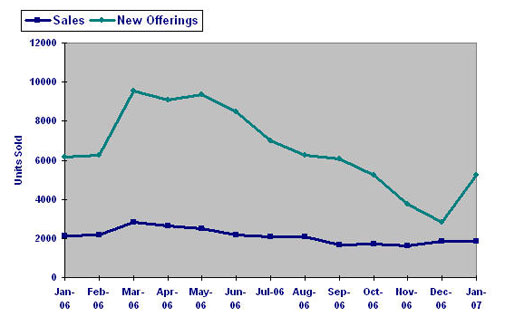
Here’s a sample of the charts available online.
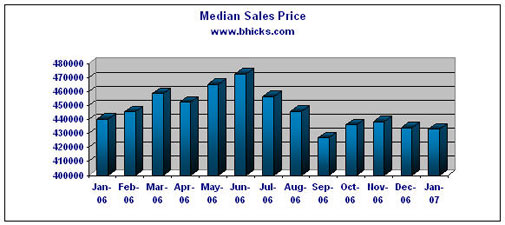
* The median price paid at the end of January, 2007, 2006 was $433,153, a decrease of 1.6% from the same time period 12 months earlier.
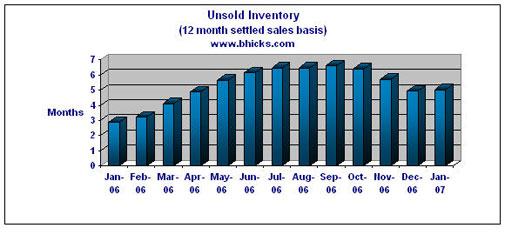
* At the end of January, 2007, inventory was 5.02 months, an increase of 175% from one year earlier.
2 Comments
Comments are closed.


Jonathan – we put a lot of focus on market trends and industry news on our site also. I was doing weekly blog posts on each but decided to switch to updating pages weekly and emphasize the links on our home page. Take a look and give me your opinion if you think going back to posting would be better.
We are firm believers in the value this type of information brings to the consumer and our branding.
Your months on market chart looks similar to the one I made for St. Paul, but we are seeing stable prices. I love looking at numbers from other markets.