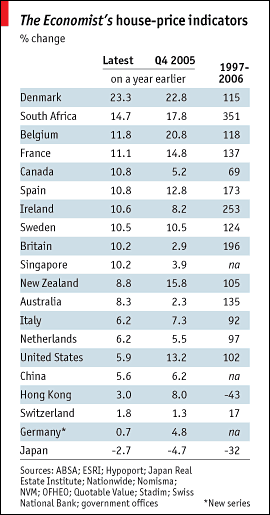
The Economist magazine has compiled its latest global housing stats [subscr]. The magazine, which I subscribe to and enjoy, has been calling for a sharp housing correction in the United States since about 2003. This compilation showed a slowdown in the rate of appreciation in 50% of the markets surveyed.
>America is one of them. In the year to the fourth quarter of 2006, the price index compiled by the Office of Federal Housing Enterprise Oversight (OFHEO), a regulator, rose by 5.9%, the lowest annual rate for seven years. The OFHEO index gives a more accurate picture than more timely series, because it tracks the value of the same houses when they are resold or remortgaged. As a result the index is not pulled this way and that by changes in the mix of houses sold.
>The housing slowdown has already made itself felt in the GDP statistics, as homebuilders have cut back on construction. So far, it has not hurt consumption, the principal engine of the American economy. But that may yet happen. Flatter prices may encourage homeowners to rein in their spending. And troubles in the subprime mortgage market may spread, inhibiting lending to borrowers in better standing, and thus feeding back into prices.
The Economist places great faith in the OFHEO for the US stats because the use of repeat sale indicators, which I think is very naive.
>American homeowners may take heart from the experiences of two other once-booming markets: Australia’s and Britain’s. Both stalled in 2005, yet both have clocked up house-price inflation of around 10% in the past year.
I am struck by the fact that most of Europe seems to be appreciating faster than the US market and how Japan showed a decline even though their central bank recent increased interest rates.
2 Comments
Comments are closed.


Actually, the OFHEO measure probably IS better than any other widely-followed measure (as from the Realtors Associations), but it does have a few problems, most notably because:
1) The measure assumes that a given home has not been upgraded (i.e. renovated, expanded, torn down & rebuilt, etc); so if a home sold for $400,000 3 years ago and now it sells for $700,000, it automatically treats it as a 75% appreciation. But, in fact, if the home was renovated, it may be that the underlying value rose by only 17%, while the renovation added 50%; that is, the home, as it stands now, WOULD HAVE sold for $600,000 3 years ago, rather than $400,000. Thus growth in the index is likely biased upward (i.e. it overstates reality)
2) The widely followed index includes refinancing appraisals, which tend to be biased, also upward, especially in period right after boom markets (like now). They do HAVE a purchase only index, which they report for the US as a whole [see but, inexplicably, not for individual metro areas. This measure shows prices up 4% from 2005Q4 to 2006Q4, as opposed to 5.9% mentioned in the Economist article. This would be the slowest rate in about 9 years (as opposed to 7).
By the way, the first issue mentioned above (1) is probably not as relevant for Manhattan’s co-op and condo market, because it’s harder to expand or make substantial renovations to an apartment than to a single-family house (esp. one on a decent sized parcel of land).
Thanks Jason! I believe that there is a big problem with relying on repeat sales, especially during the housing boom. So many houses were either upgraded or expanded (or torn down). It makes the repeat sale concept pretty weak since the physical asset changed so much. I’ll grant that during other periods with out the intensity of development, it may have been more accurate. Repeat sales indexes are better suited for long periods of time, not to track sudden market changes IMHO.