Skip to content
Services
Appraisals
Consulting
Resources
Market Reports
Charts
Matrix Blog
Articles & Research
Press
About
get in touch
Charts
› New York City
February 10, 2026
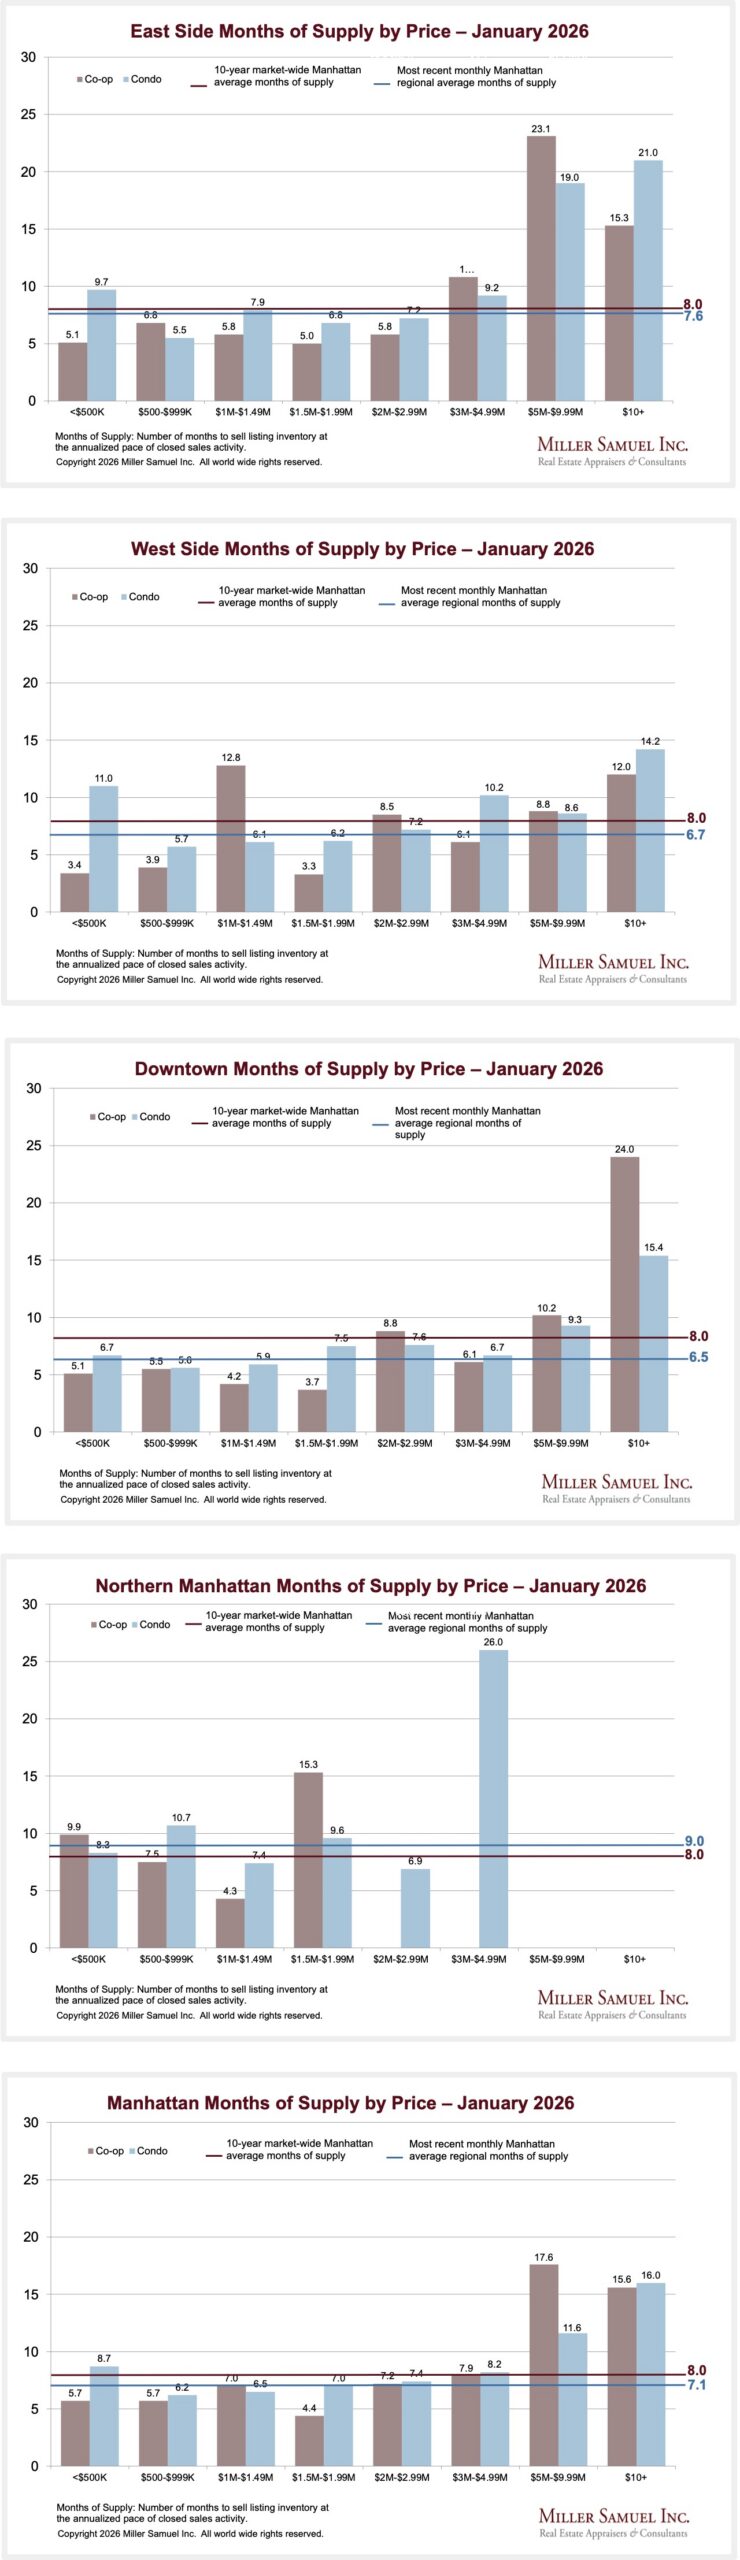
1-2026: Manhattan Months of Supply by Price (by Region)
read more
February 10, 2026
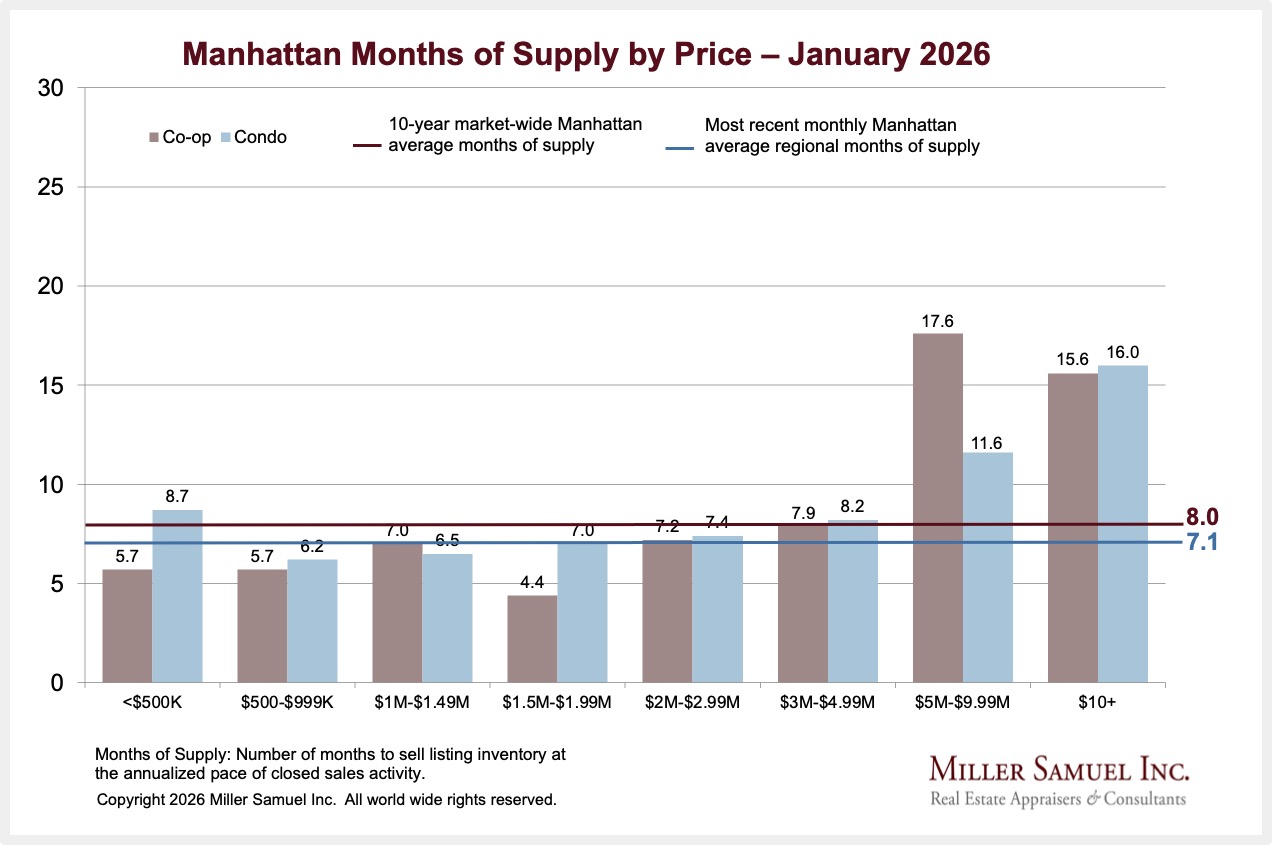
1-2026: Manhattan Months of Supply by Price
read more
January 6, 2026
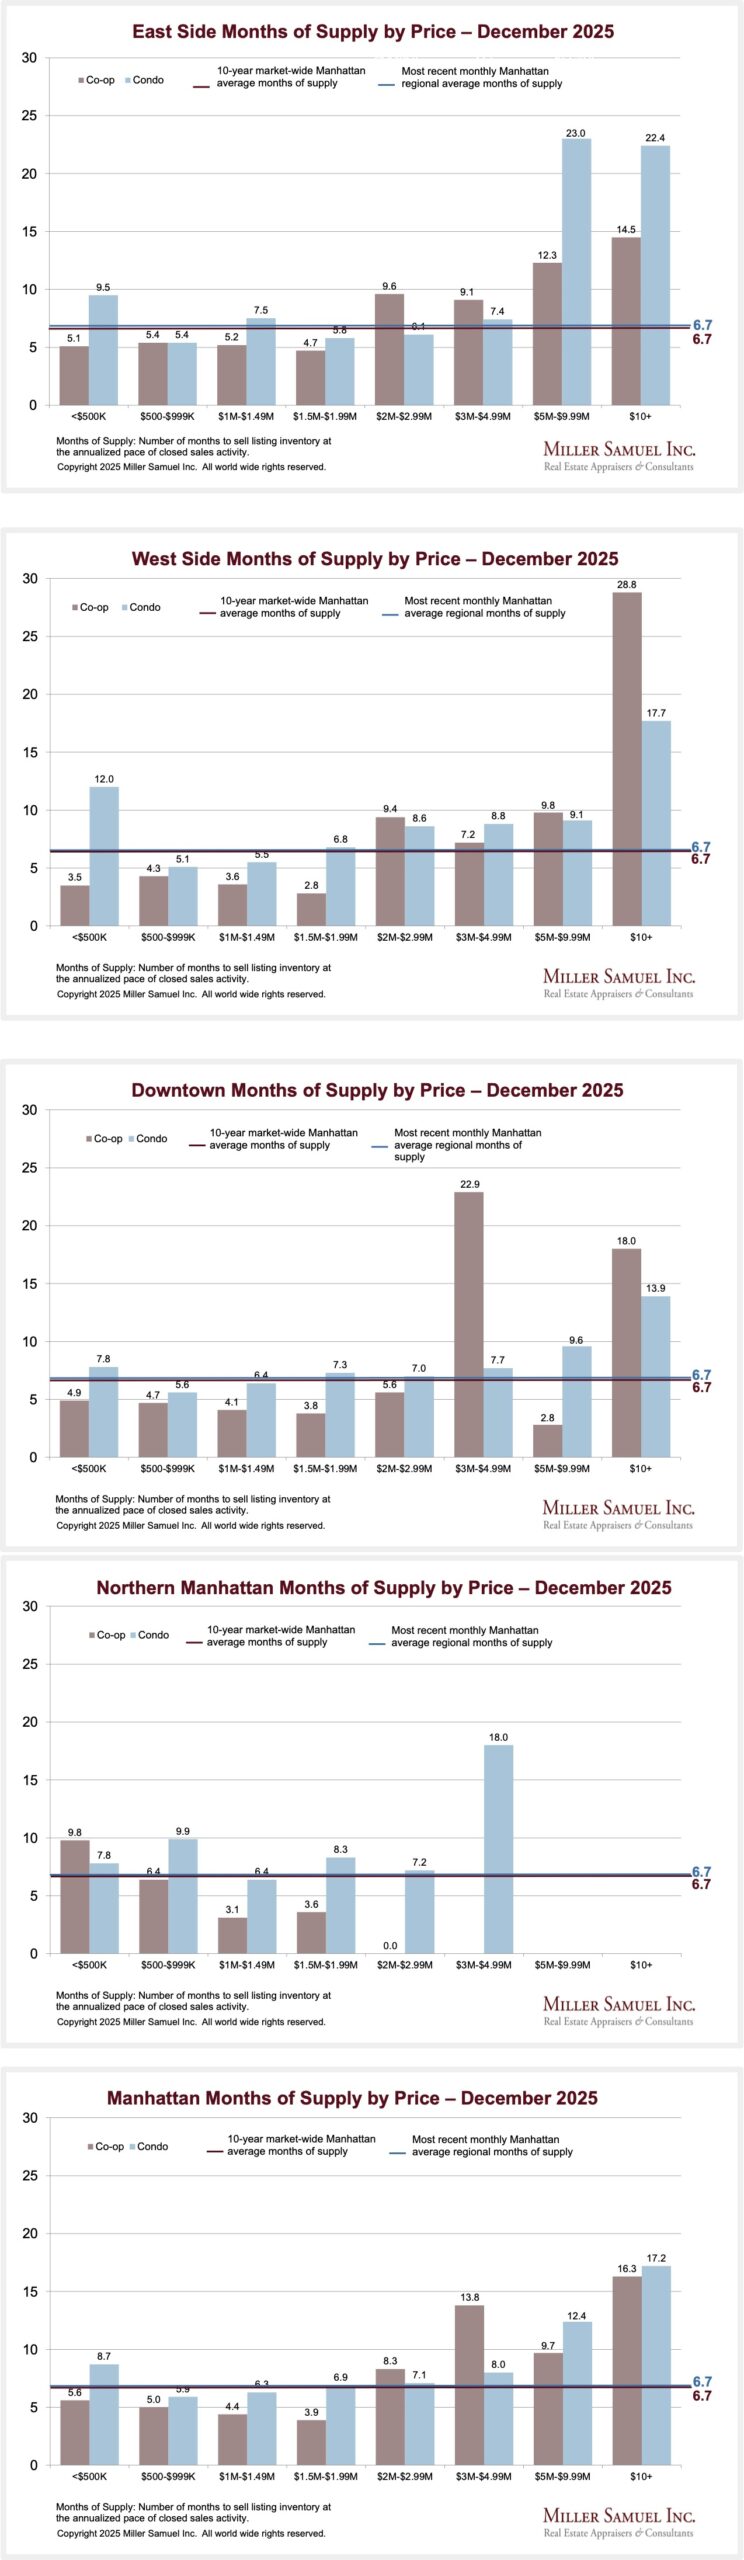
12-2025: Manhattan Months of Supply by Price (by Region)
read more
January 6, 2026
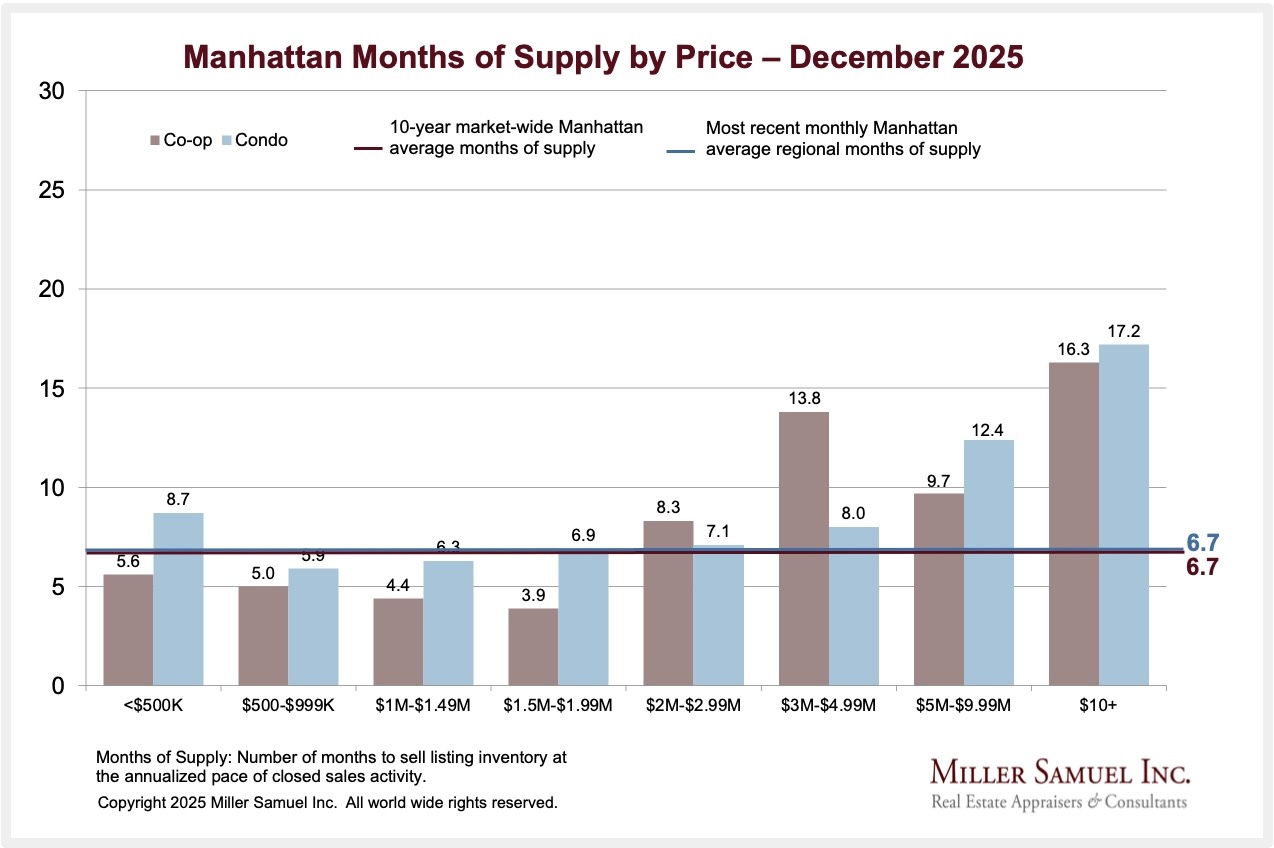
12-2025: Manhattan Months of Supply by Price
read more
October 2, 2025
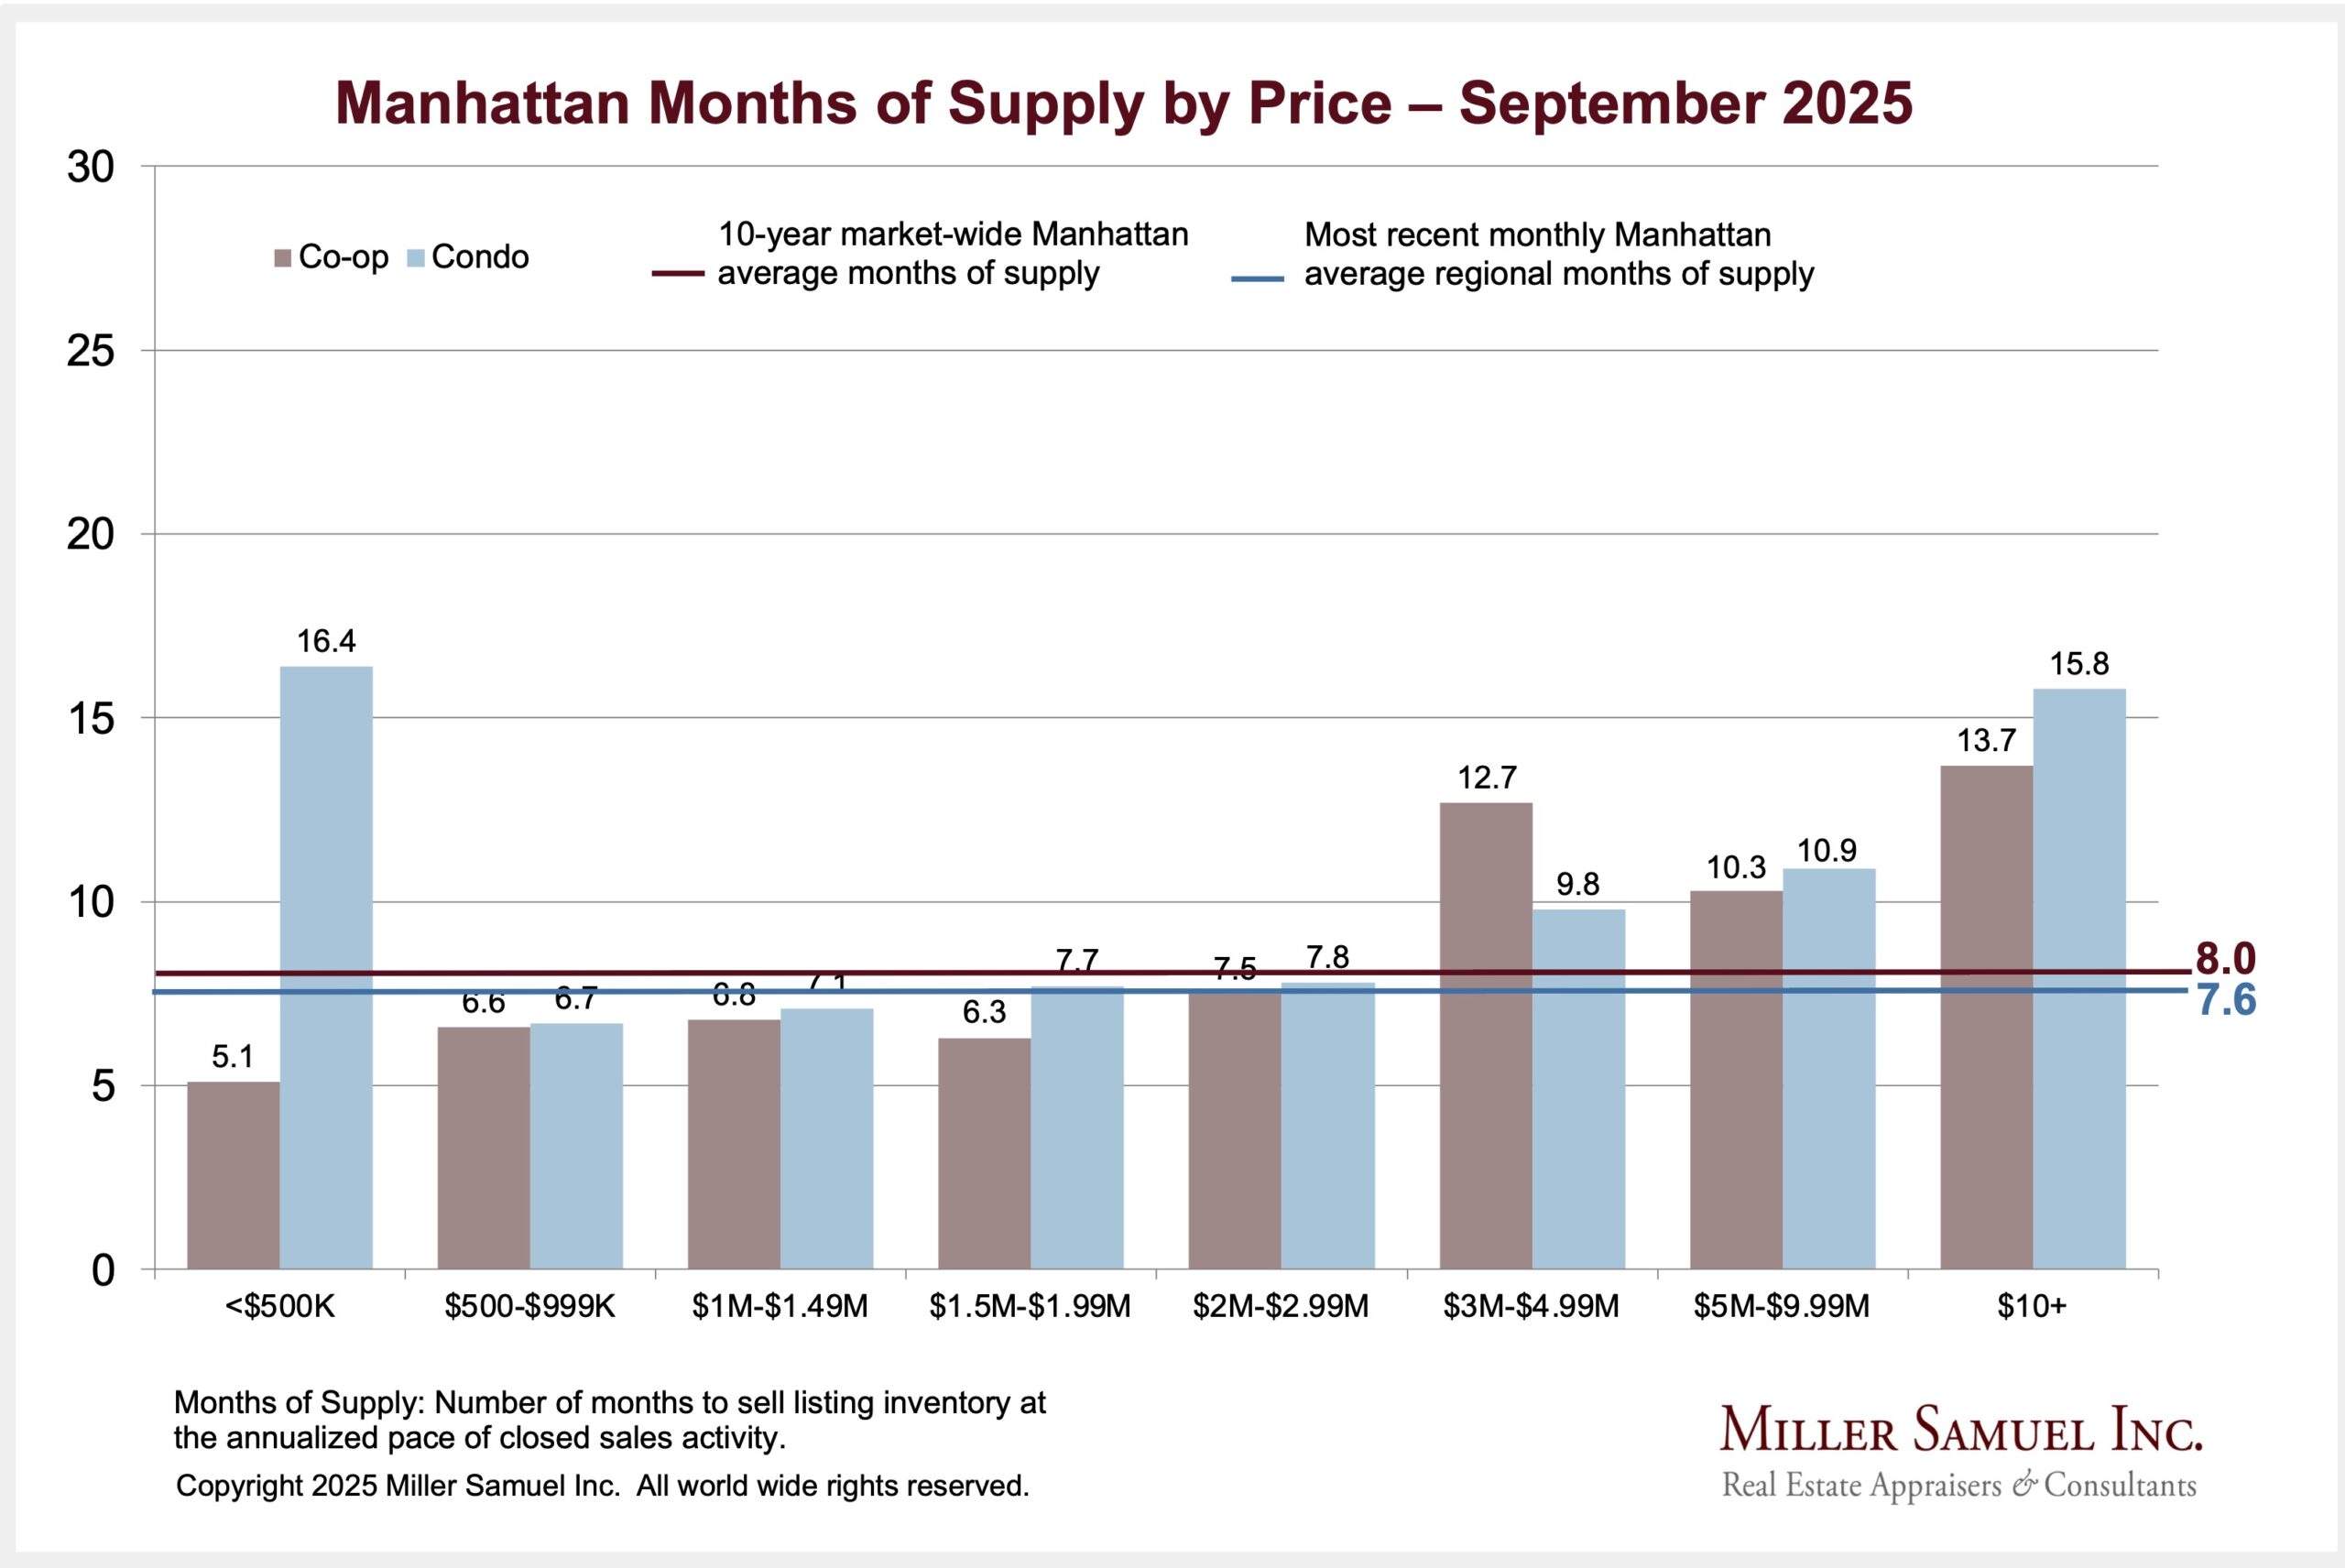
9-2025: Manhattan Months of Supply by Price
read more
September 11, 2025
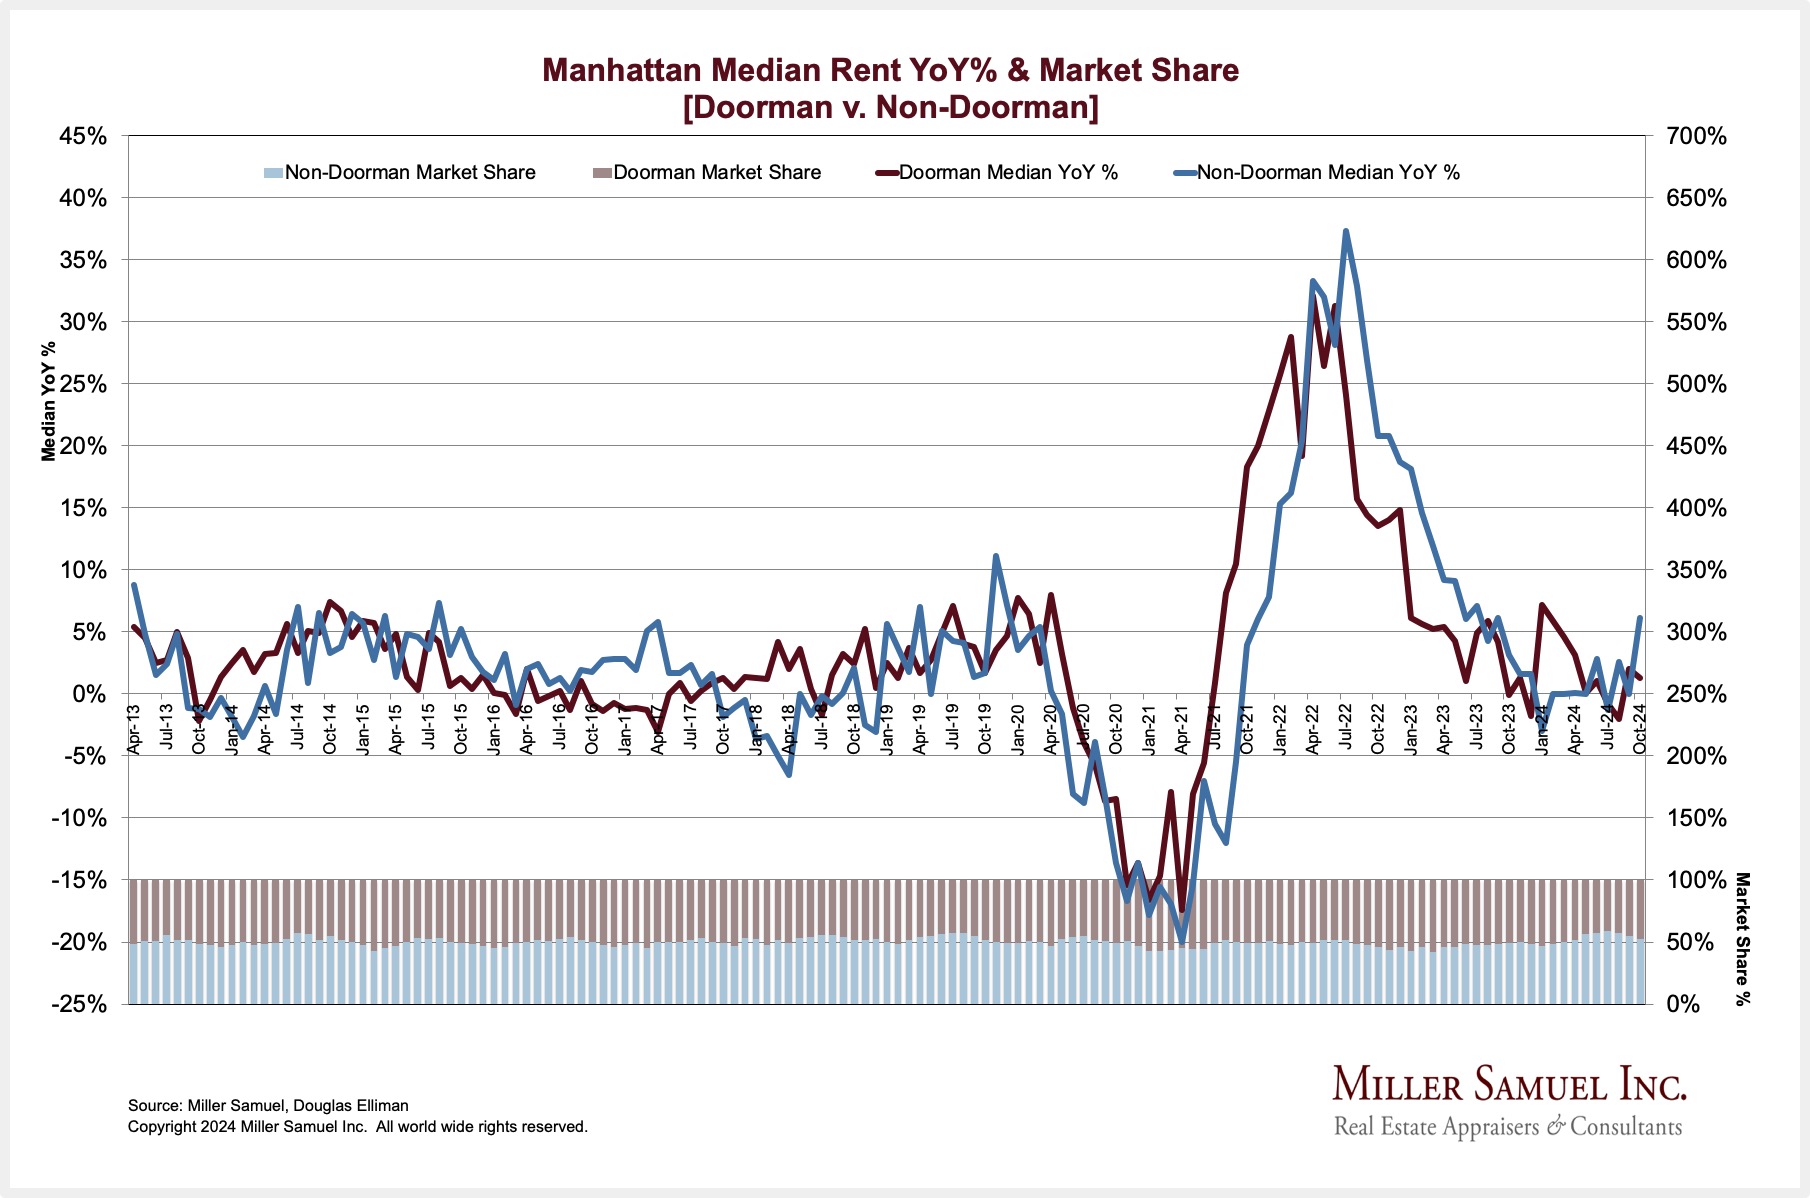
Manhattan Median Rent YoY% & Market Share [Doorman v. Non-Doorman]
read more
September 11, 2025
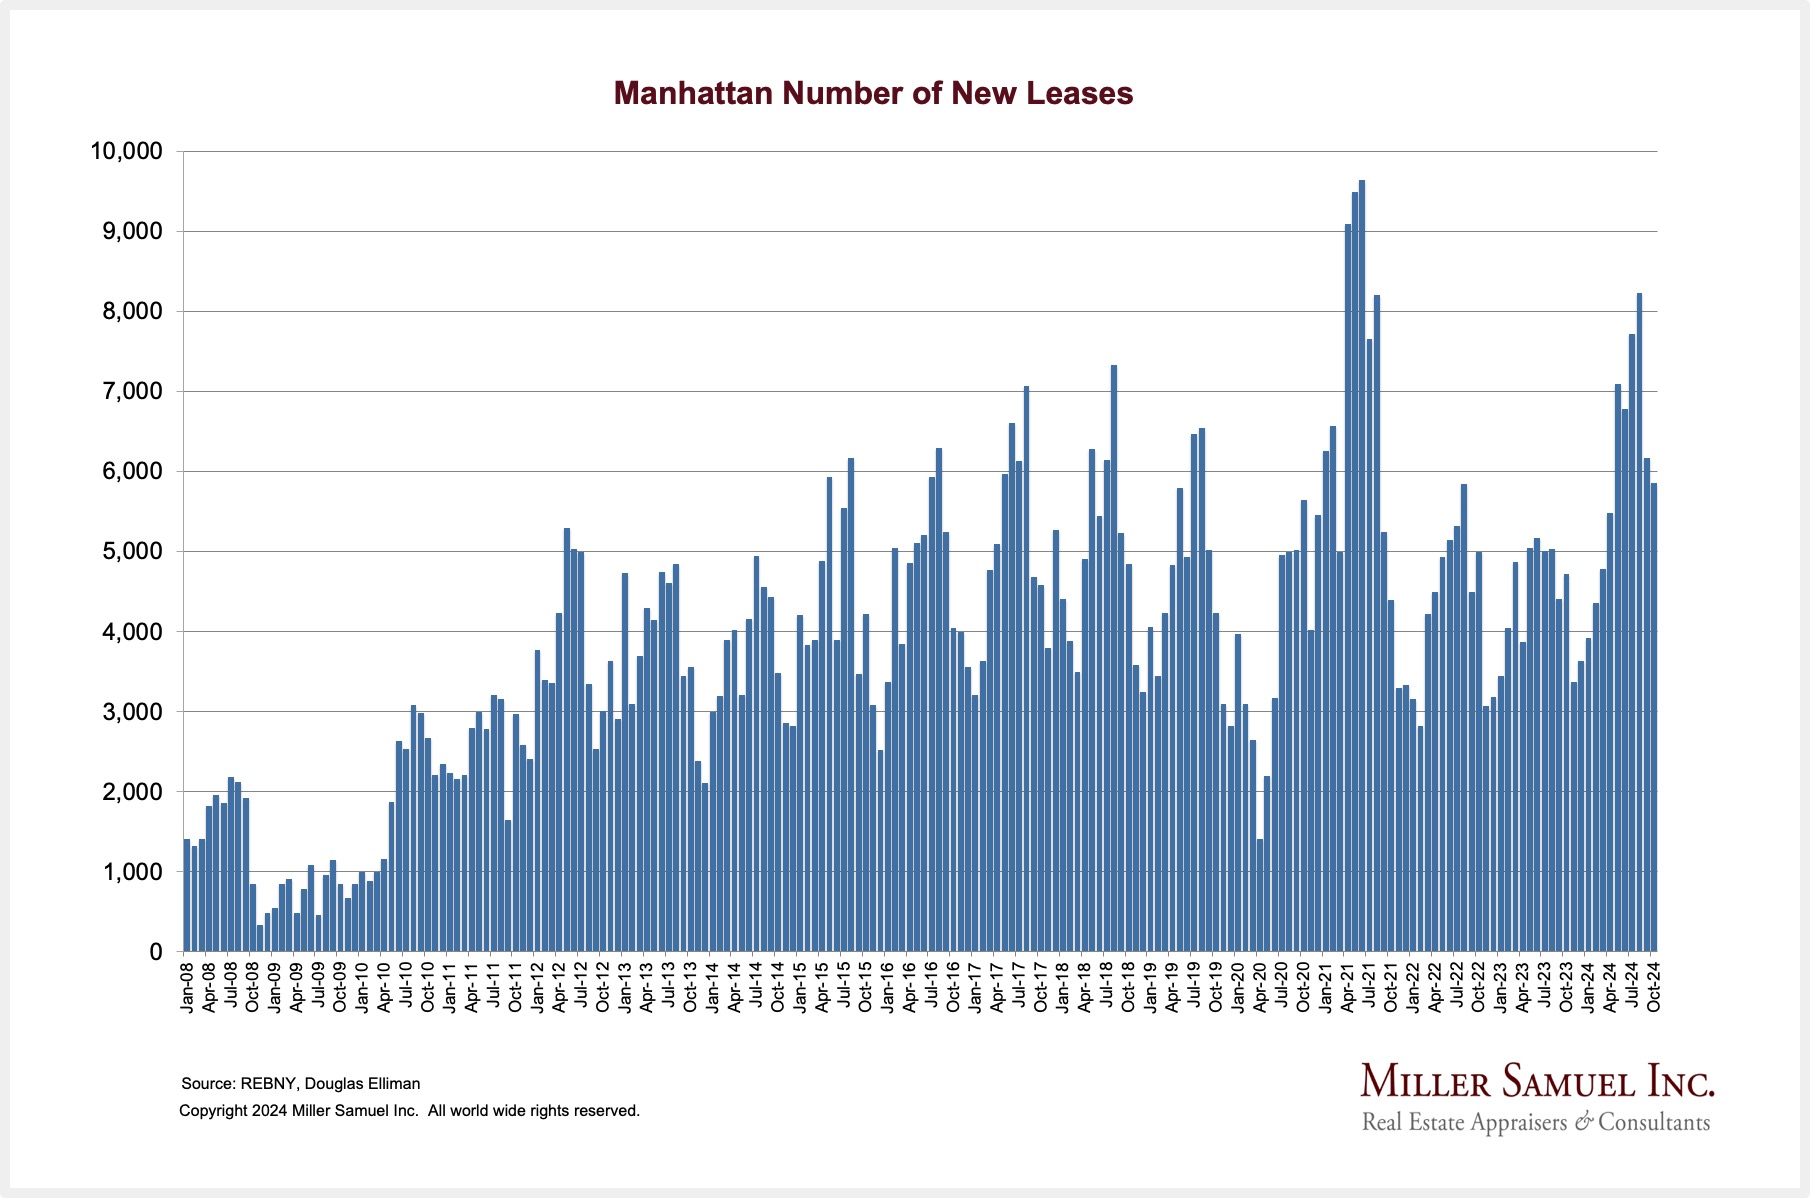
Manhattan Number of New Leases
read more
September 11, 2025
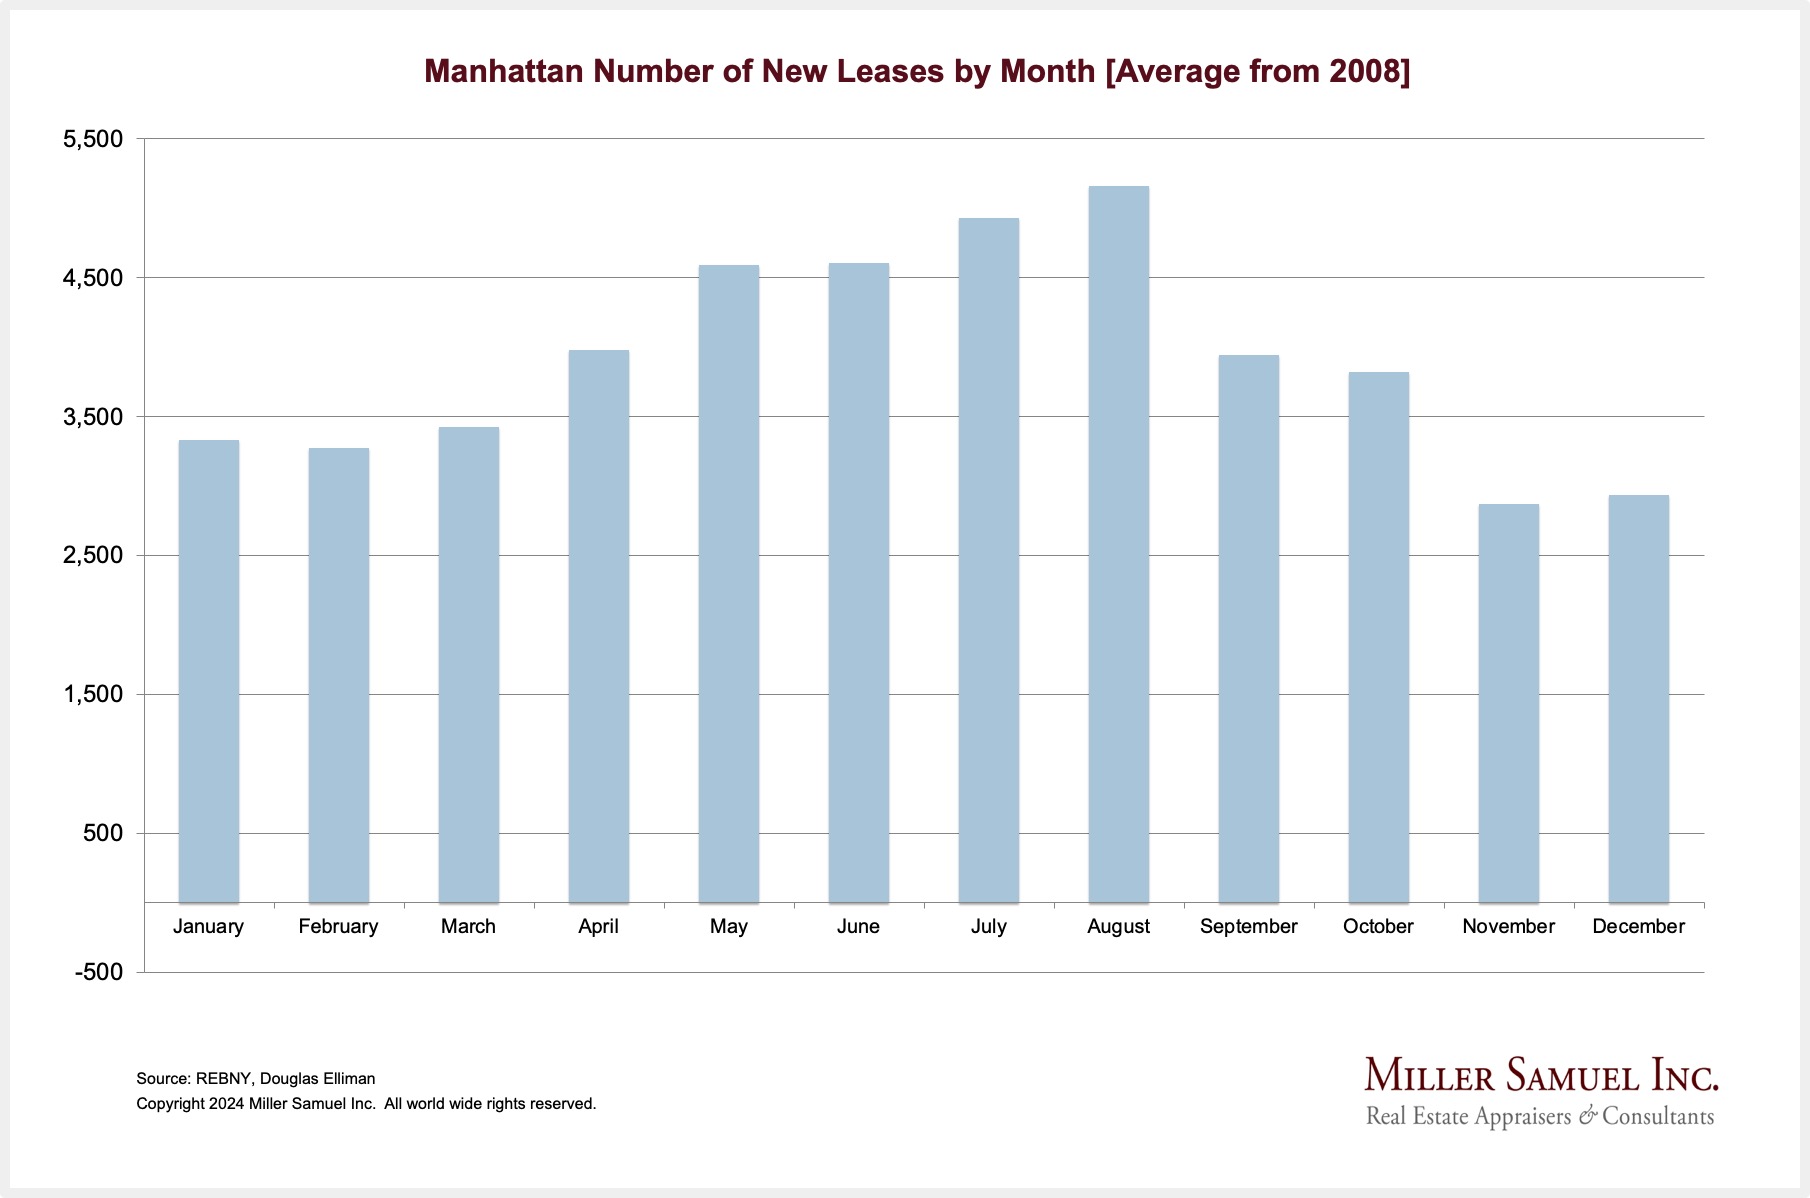
Manhattan Number of New Leases by Month [Average from 2008]
read more
September 11, 2025
Manhattan Rental Listing Inventory by Month [Average from 2008]
read more
September 11, 2025
Manhattan Y-O-Y % Change in Median Rental Price
read more
September 11, 2025
Manhattan Rental Market Listing Inventory v. Vacancy Rate
read more
September 11, 2025
Manhattan Residential Rental Vacancy Rate
read more
1
2
Next
Load More Charts
Page load link
Go to Top