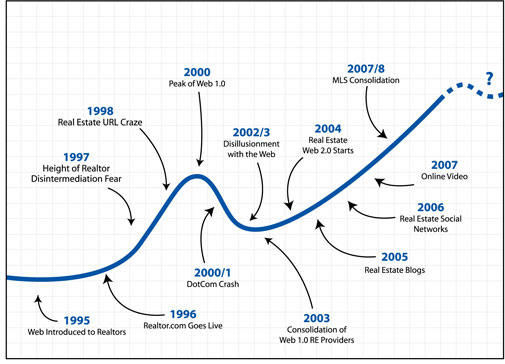
I was attending a real estate awards breakfast last week and the above chart was used in the visual presentation, which stood out among the others used. I thought was pretty cool. The chart turned out to be Stefan Swanepoel’s chart from his new book on real estate trends for 2008. He quoted me in last year’s version and I found his efforts to be insightful. This year’s version is just as good:
>According to the report, real estate professionals “will have to readjust their DNA and understand that transformation has become mandatory if they wish to be part of the winning side of the industry’s constant evolution. The involvement of the Department of Justice (DOJ), the changing borders and boundaries of MLS and identity theft are three of the concerns covered in the 2008 edition. “Smart brokers, managers, association leaders and team leaders will use 2007 to restructure their businesses, gain the additional knowledge and skill set so as to maximize every opportunity that will ignite success and profitability,” Swanepoel emphasizes.
He cites Matrix among his list of must read blogs. Real Estate Tomato lists Stephan’s blog favorites for us.
5 Comments
Comments are closed.


Love that chart.
And Swanepoel is obviously not clueless if he picked Matrix as a must read. Congrats Jonathan!
Jonathan – I saw the “must read list” on Jim’s blog however this chart is awesome – thanks for sharing it. Looking forward to hearing more about his report.
Jonathan,
I never heard of the guy before today. Thanks.
And thanks for sharing the graph too.
[…] worth investing in…of course, what could I have been thinking. Maybe it’s not big enough to buy a house, but it’s a good chunk of money that will grow into something much bigger over time. Boring […]
To my friend at Reno Real Estate. If you have not yet read Stefan Swanepoel’s stuff, do yourself a favour and get his annual real estate trends study. I promise you it is the best read about the real estate industry and where its heading, bar none. His website http://www.retrends.com also has lots of other cool graphs and articles.