Matrix Blog

Posts Tagged ‘National Association of Realtors’

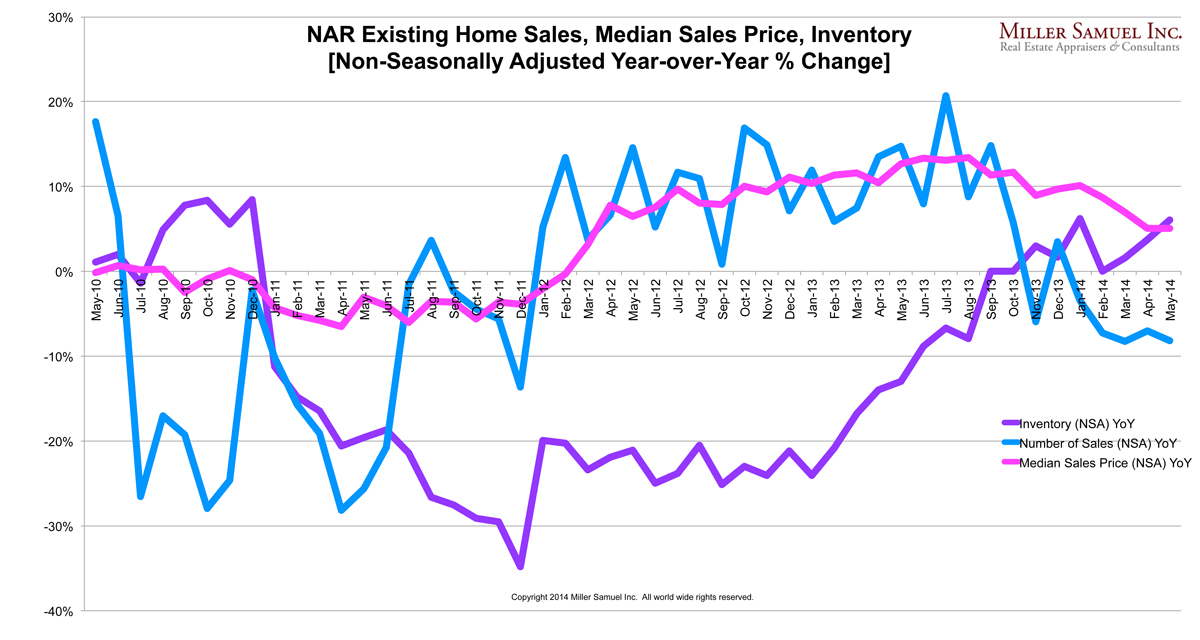
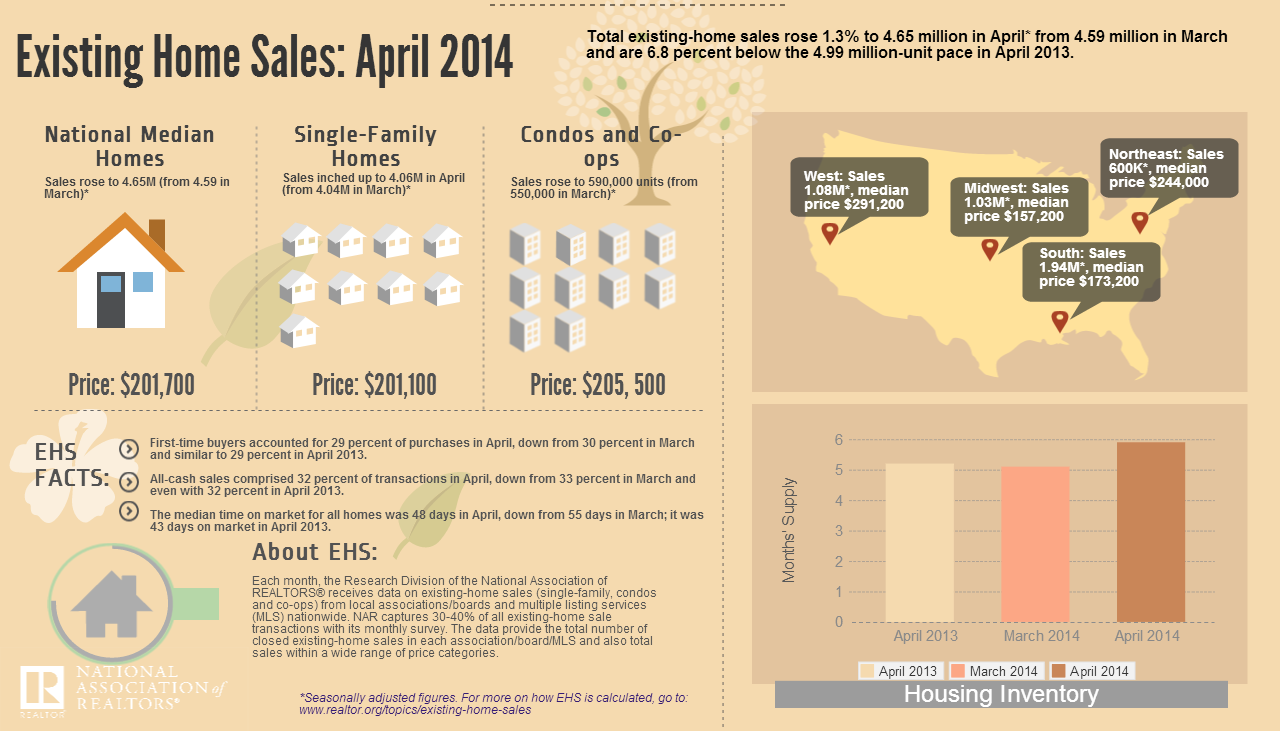
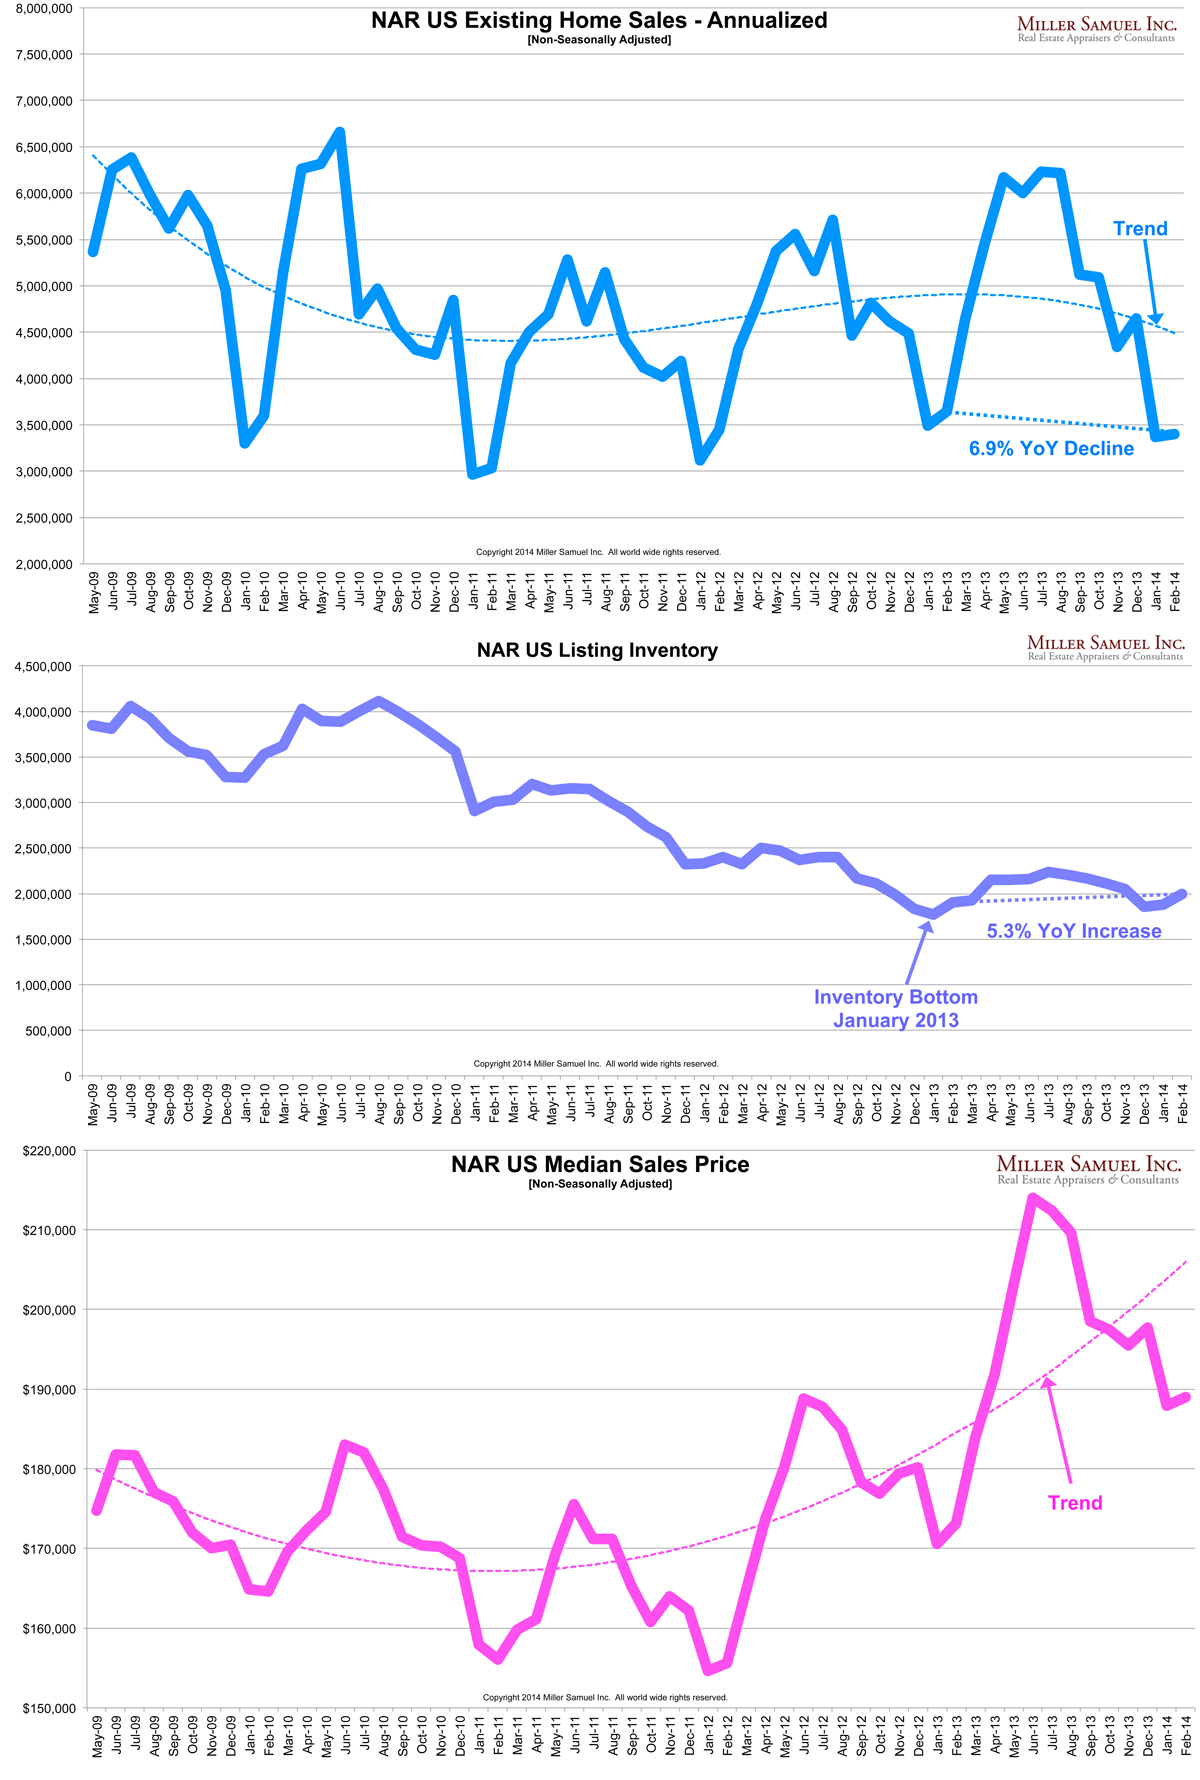
NAR May 2014 Existing Home Sales: ‘Heat-up’

June 23, 2014 | 2:54 pm | Charts |

6-23-NAR-EHSperc

[click to expand]

I always like to parse out press release of the NAR Existing Home Sales Report using their data but presented it with proper emphasis. I believe these charts are better ways to interpret the report results.

My two big rules: ignore seasonal adjustments and focus on year-over-year results. The consumer doesn’t know that the EHS report results are heavily adjusted rather than providing the actual results.

Since the annual sales figure is a multiplier of a monthly figure, why do we need to alter the actual numbers any more by adjusting for seasonality? Through recent periods like the possible expiration of the Bush tax cuts (end of 2010), the federal homeowners tax credit for new buyers and existing home buyers as well as the expiration of the fiscal cliff at the end of 2012, seasonal adjustments are subject to maddening skew.

For much of 2013, median sales price was rising at an annual rate of more than 10%…

  • It’s good to see the pace of the market returning to more sustainable conditions – last year’s market was not normal with rapid price growth and tight supply.
  • Now we are seeing inventory return to the market and rate of price growth is easing. Both are good news.
  • Mortgage rates have slipped but still not to the lows of early 2013. Falling rates not helping sales rise because last year was a release of years of pent-up demand.
  • First time buyers are still not as active as they need to be, with their share down to 27% from 29%. Typically they shold account for at least 1/3 of the market. Tight credit and tough job market are reasons (not a lifestyle changes).


6-23-NAR-EHS

[click to expand]

Tags: , , ,


New Angle: Blame Low Mortgage Rates

June 23, 2014 | 10:37 am |

mnd30year6-2014

The National Association of Real Estate Editors just held their annual conference and one of the experts was Lawrence Yun, the chief economist of the National Association of Realtors.

Admittedly he has always seen the real estate world through different lenses than I so I am often thrown for a loop when I come across some of the rationale for the current state of the housing market.

A local media outlet recapped his NAREE speech but since I didn’t attend and there is no transcript, I’ll go with the following paraphrasing:

Mortgage rates reached record lows in 2012 and 2013 of around 3.3 percent for 30-year home loans. Homeowners don’t want to let go of those once-in-a-lifetime bargain mortgages, says Lawrence Yun, chief economist for the National Association of Realtors. So homeowners avoid putting their homes on the market in order to keep those low mortgage rates and that has resulted in super low inventories of home for sale. Although rates are still low (less than 5 percent) many people are opting to rent out their houses so they can hang onto great mortgages, Yun says.

Here’s another way to look at what he says is happening:

Yun – Home sales are not rising (year-over-year) because mortgage rates are so low that would-be sellers won’t sell. They simply love their low mortgage rate more than moving.

My view – Home sales are not rising (year-over-year) because of a combination of rapidly rising home prices that reduces affordability and historically tight mortgage lending standards that resulted record low inventory. Tight credit keeps the roughly 40% of home owners with low or negative equity from selling because they don’t qualify for the next mortgage. Hence, sales fall.

There is clearly way too much emphasis on mortgage rates in our housing economy.

Tags: , , , , , ,


Tall and Thin Skyscraper Renderings: the New Bricks and Mortar

June 10, 2014 | 10:05 am |

nyposttall1

[click to expand]

The New York Post ran an article on Sunday “Chinese buyers snapping up NYC skyscrapers” that was chock full of Manhattan skyscraper renderings – I found myself clicking through all of them. While I already am familiar with each of these residential and commercial towers, I never get tired of looking at them.

While I’m no architectural critic and some of these designs are controversial, even cited as dangerous, I must admit I really like the genre. I was fatigued from enduring the boring, utilitarian and ultimately generic designs throughout the 1980s and 1990s.  We got a sampling of this new genre in the last new development boom a decade ago, but with the shift towards the higher end of the market, there seems to be more money available for creating iconic designs.

As far as the China hyperbole cited in the piece, it is an assumption based almost exclusively on anecdote as well as 2013 research by National Association of Realtors (cited as “US National Real Estate Association” but had no luck finding it with Google so I assumed they meant NAR). And how do we rely on an NAR survey of it’s members when so few Manhattan real estate agents are members of that trade group?

I’ve inserted all the renderings below: I’m not going to  bother labeling them since that’s not the point – you can get that detail in NY Post piece.  These are placed here for your oogling pleasure.

HudsonYards from West Chelsea (c) Related Cos..jpg

ARTS ARCHITECTURE

432PA_SE View from Central Park_copyright dbox for CIM Grou.jpg

photo.JPG

99 Church Street, Silverstein Properties, New York

56 Leonard -Woolworth view - Credit Herzog  de Meuron.jpg

53W53rd Street entrance.jpg

World Trade Center

OneVanderbilt_03_Looking-East-from-Bryant-Park.jpg

Tags: , , , ,


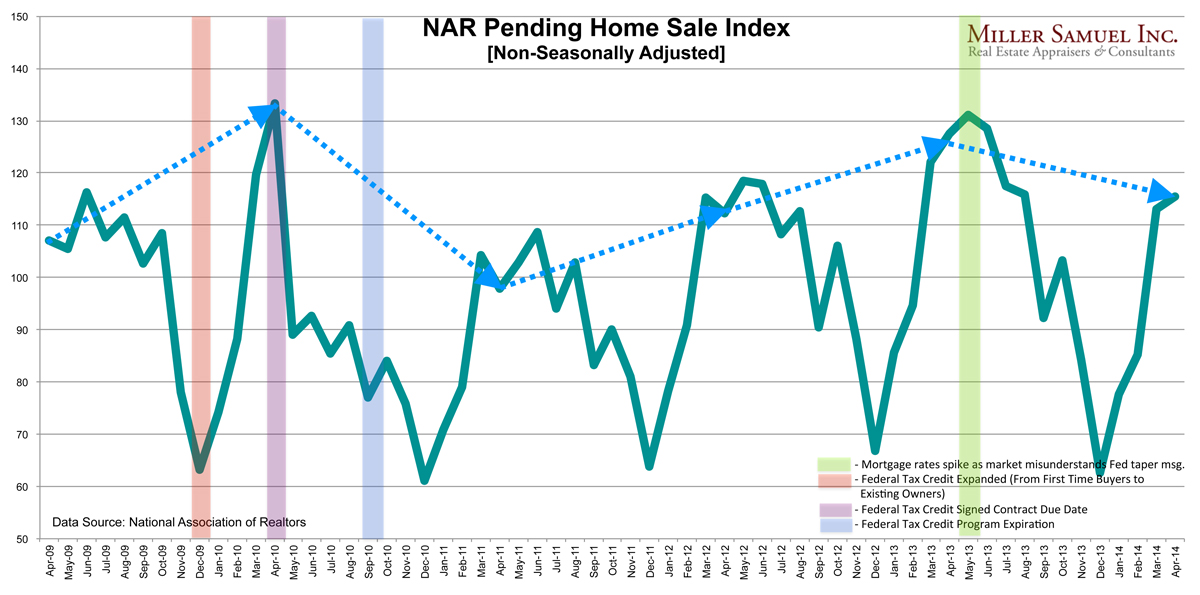
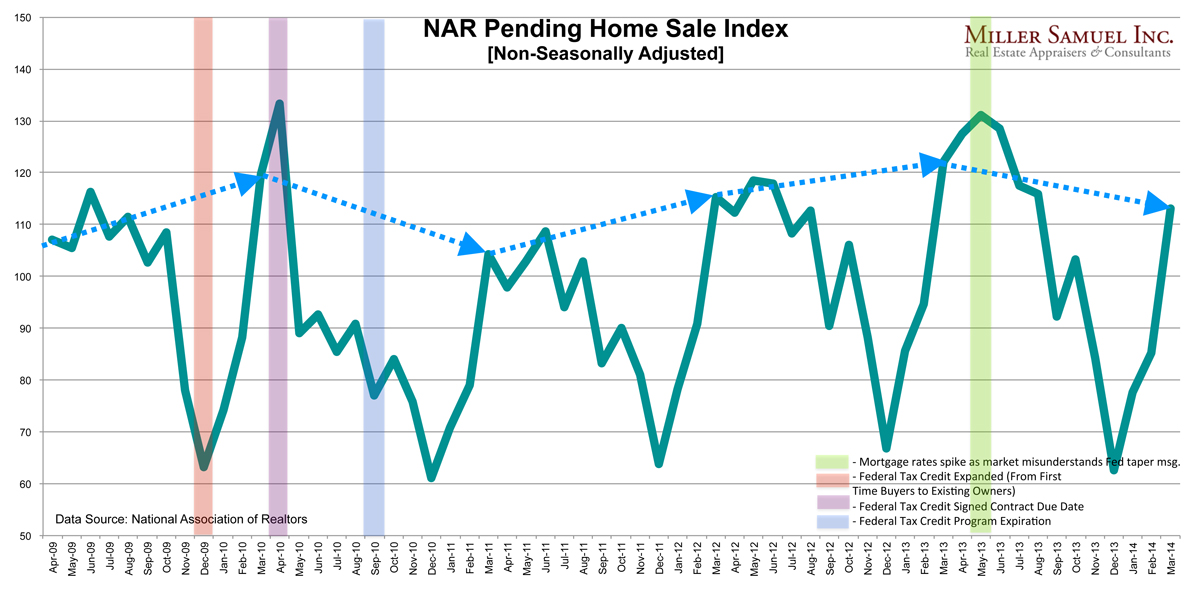
Pending Home Sales Fall Short of Year Ago Sales Surge

May 29, 2014 | 4:29 pm | Charts |

2014-april-phsi-05-29-2014
[click to expand]

The NAR released their Pending Home Sale Index today for April which aggregates signed contract data for the month. It is generally 2 months closer to the “meeting of the minds” between buyer and seller than their existing home sale report, that is based on closed sales (and 4 months faster than Case Shiller).

Pending Home Sales Index is not “forward looking”
In my chart above, and if you know me, I hate seasonal adjustments (SA) in housing data so this chart uses NAR’s reported numbers without adjustments. NAR always frames this release series as “forward looking” when it really is “less backward looking” because it is based on contracts, not closed sales. The end of May report reflects April contracts, half of which were probably signed in Late March. With a 2 month spread between contract and closing dates, this report is the most recent US housing market snapshot but nothing about it is actually “forward looking.”

With all the weather talk and mixed housing market messaging over the last month, this release brought us a broad range of interpretation, from “plunging” to “edging higher.”

Well, which is it? Or could it be both? Yes it can. We just need context.

According to Housingwire (uses SA numbers): Pending home sales plunge 9.2% in April So much for that post-winter, pent-up demand

Pending home sales for the month of April plummeted 9.2% compared to April 2013, the National Association of Realtors reported Thursday.

Contracts signed to buy existing homes increased 0.4% in April compared to March 2014, but that’s coming off three months of flat sales blamed on cold weather.

The expectation had been for at least a 2% gain month-over-month.

According to Diana Olick at CNBC (uses SA numbers), Pending home sales up just 0.4% in April, missing expectations

Warmer weather and higher expectations failed to cause a meaningful surge in home sales.

Signed contracts to buy existing homes increased just 0.4 percent in April, according to a monthly report from the National Association of Realtors (NAR). The expectation had been for at least a 2 percent gain sequentially.

The Realtors’ so-called pending home sales index is now 9.2 percent lower than April of 2013.

What’s going on?

If you look at the above chart you can see that last year’s pending home sales were surging up until May 2013, their highest level in 3 years (since the federal homeowner tax credit program as part of the stimulus). The surge in contracts in the first half of 2013 was born out of consumer fears that rates were going to rise. In addition, all the pent-up demand accumulated during the two year period preceding the US election and fiscal cliff deadline was released into the market. Many fence-sitters became decision-makers.

This winter’s harsh weather could have delayed buyers and we should be seeing this uptick in activity by now. We probably are seeing it but it no match for the year ago surge in activity but now the market is being characterized as weak or weakening. The problem with that description is it assumes that 2013 was a normal trend of an improving market. Well it wasn’t.

So yes, sales are down from the 2013 sales surge anomaly and the weather time-shifting buyers forward further into spring this year was no match for it. In fact, I suspect the next month will show the same type of “weakness” and the PHSI results probably can’t show real improvement at least until June.

Tags: , , , , ,


Thank Goodness The Pace of US Home Price Growth Will Cool

May 27, 2014 | 3:18 pm | Charts |

2014-april-ehs-infographic-05-27-2014
[Source: NAR, click to expand]

Last week we were given another dose of housing news – housing sales didn’t go negative for the first time in four months (m-o-m) as inventory continued to expand and prices kept rising. Even though mortgage rates are down to what they were shortly after the rate spike last spring, it’s not stimulating much of an increase in sales activity (translation: no correlation between housing prices and mortgage rates). I still refer to Nick Timiraos’ epic post of charts last month. Lower sales will continue to expand inventory and take the edge off of price growth.

Looking back over 2013 – the housing market wasn’t “recovering” – prices were rising from the perfect storm of tight credit, sentiment that things were getting better, surviving the fiscal cliff and threat of rising mortgage rates. The market was rebounding off a low point that had nothing to do with fundamentals. I still think we will see some improvement over the next several years but it will be nominal until the economy shows real improvement i.e. jobs, income and credit.

Removing all seasonal adjustments, here’s what the key NAR US Existing Home Sale metrics look like to me:

matrix5-23-2014

UPDATE Here’s a wonky explanation from the Federal Reserve Bank of San Francisco of the existing sale slow down in their Economic Letter.

Tags: , ,


PBS Newshour – Making Sense of Weak US Housing Reports

April 28, 2014 | 5:10 pm |

Michelle Conlin of Reuters gives a nice overview of the state of the US housing on PBS, talking through the national reports that hit us recently. Check it out. This month’s weak NAR Existing Home Sales report has unleashed a surge of housing self-loathing (although today’s PHSI seems to take some of the drama/edge off).

Tags: , , , , , , , ,


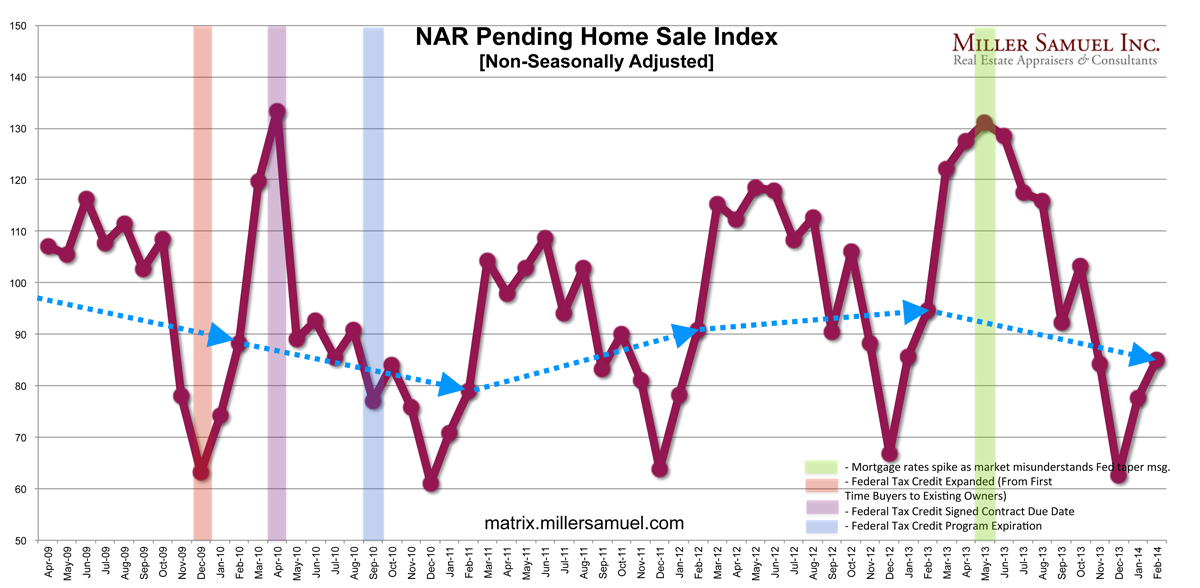
NAR Pending Home Sales Had Biggest “February to March” Jump in 4 Years

April 28, 2014 | 4:52 pm | |

4-28-14PHSI
[click to expand]

After all the housing news drama of the past month, I thought it was interesting to see the negative streak broken. Still, sales are below year ago levels after what I described as a “release of pent-up demand” that was caused by the expiration of the “fiscal cliff” and the looming rise in mortgage rates last year.

Although home sales are expected to trend up over the course of the year and into 2015, this year began on a weak note and total sales are unlikely to match the 2013 level.

All the indices NAR publishes bother me because they include seasonal adjustments and those adjustments can be very severe. The chart above has no seasonal adjustments so you can see how much adjusting has to take place to smooth out the line. I thought I’d take a look at the month-over-month data that wasn’t seasonally adjusted to see if the same pattern occurred.

4-28-14PHSIfebtomarch

Yes, month-over-month pending sales rose the most since 2010 when the market was wildly skewed (higher) as a result of the First-Time Homebuyer Credit (federal first time buyer and homeowner tax credit).

February to March 2014 had the largest increase in contracts than the same period in each year since 2010.

Tags: , , , , ,


Pending Home Sales Down 10.2% YOY And That’s Not A Bad Thing

March 27, 2014 | 11:55 am | Charts |

NARphsi3-27-14
[click to expand]

NAR released their pending home sale index today and the news was not unexpected. US home sales volume has slowed since last spring’s taper miscue by the fed which caused mortgage rates to jump. If you look at the May surge in pending sales, sales volume, seasonally speaking (comparing year over year) has fallen 10.2% (unadjusted).

The introduction of QM earlier in the year probably doesn’t help volume levels, but I’m not really convinced that the housing recovery is actually stalling. It seems more like sales levels are settling to more sustainable levels. And as sales go, so goes the insane price gains seen in the national reports.

Tags: , , , , ,


NAR Existing Home Sales Blink, And So What?

March 23, 2014 | 9:00 am |

NAR released their Existing Home Sales Report on Thursday with a headline that read: February Existing-Home Sales Remain Subdued that blamed the severe winter weather and low inventory for lower sales.

Of course inventory has been near historic lows for a few years so that’s not a new reason. I’m left with the weather and as someone who hates to use the weather as a crutch, it seems to be a pragmatic – it’s difficult to show or be in the mood to view properties when it is zero degrees outside. The weather explanation was also used in the prior report but those contracts were signed in December for the January report, before the “polar vortex.”

However the recent hand ringing caused by the downshift in sales is the concern that the recovery is cooling off.

I see the recent fretting about the cooling of housing as an indication of how improving conditions were based largely on Fed policy and not fundamentals. The combination of rising mortgage rates and declines from the year ago release of pent-up demand post-“fiscal cliff” likely gets price gains and sales levels in sync with fundamental economic conditions.

I’ve charted NAR EHS stats from the past 4 years without seasonal adjustments. Price gains have been insane so the combination of slowing sales and rising inventory will take the froth out of the market and hopefully get us on a more sustainable path.

2-14NARehs

Tags: , , , , , , ,


On Bloomberg TV’s ‘Bottom Line’ 2-12-14 Talking US Housing Slowdown

February 14, 2014 | 5:24 pm | | TV, Videos |

Had a great discussion with Mark Crumpton on his show “Bottom Line” about the slowing US housing market. You can see this in the quarterly results:

The median existing single-family home price increased in 73 percent of measured markets, with 119 out of 164 metropolitan statistical areas (MSAs) showing gains based on closings in the fourth quarter compared with the fourth quarter of 2012. Forty-two areas, 26 percent, had double-digit increases, two were unchanged and 43 recorded lower median prices.

The storyline of the last 2 years has been “Housing is Back!” yet prices were rising based on fed policy, not due to fundamentals like income, employment and access to credit. I have been labeled as a bit bearish on the “recovery” but I’m really not. I look at this slow down as a good thing for the long view on housing. We need to have sustainable housing growth (ie sales and prices) and 13.7% YoY price gains are in start contrast to economic fundamentals.

During our interview we were interrupted by the signing ceremony with President Obama for the new minimum wage act, so Bloomberg TV spliced the two parts together quite nicely. This is the second or third time one of my interviews has been interrupted by the President of the United States. Yes, I’m ok with that. 😉

Tags: , , ,


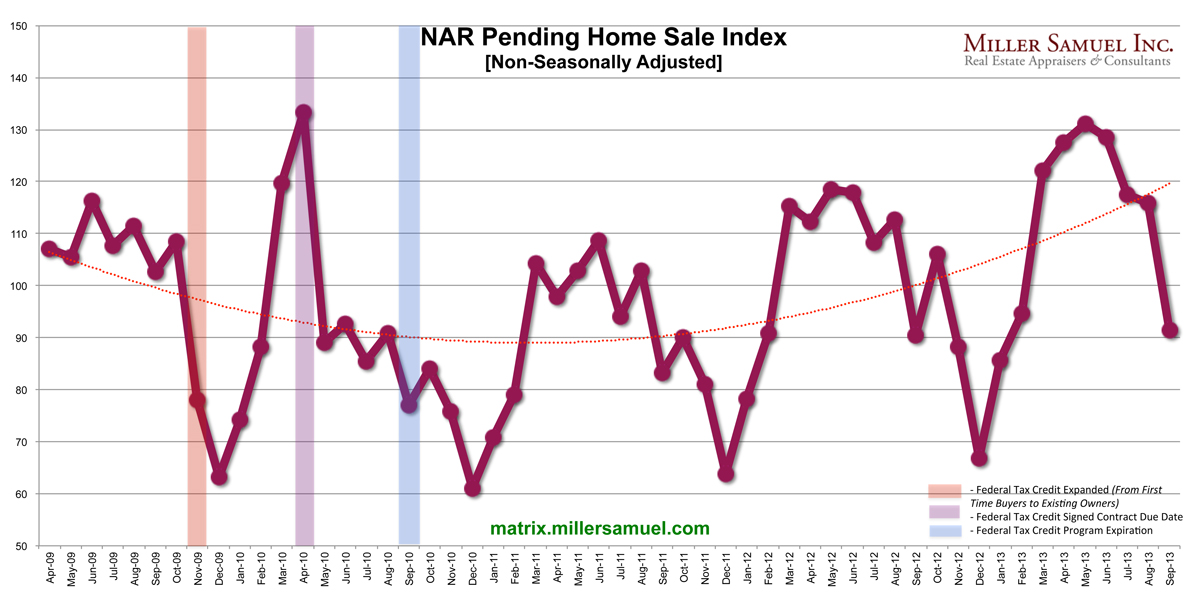
NAR Pending Home Sale Index Sort of Goes Negative

October 28, 2013 | 7:31 pm | | Charts |


[click to expand]

According the National Association of Realtors, their Pending Home Sales Index fell 5.6% from August to September 2013 (seasonally adjusted), the largest monthly drop since May 2010 after the artificial prop of the 2009-2010 federal homebuyers tax credit expiration caused contracts to drop by nearly 1/3 from bloated levels.

Removing seasonality from the results makes the year-over-year adjustment show nominally 1.1% higher contract volume from September 2013 than in 2012 rather than a 1.2% decline. Still, the results were weak.

Why did pending sales post weaker results?

  • Don’t blame the partial government shutdown – that came later.
  • After the May 2013 Fed surprise announcement, fence sitters surged to the market to lock in before mortgage rates rose further, bloating contract volume over the summer (and why month-over-month seasonal adjustments to this data are so very misleading).
  • The surge in summer sales “poached” from future organic volume that we would have seen in September so we were already expecting a slow down in volume. Didn’t we learn in 2010 what happens when unusual circumstances press volume sharply higher only to see volume fall sharply when that circumstance disappears?

Weaker conditions prevail, but its really not as bad a report result as being discussed – namely because the seasonal adjustments paint a weaker picture than what actually happened, and we expected a decline in activity because the prior several months were artificially pushed higher with so many more buyers rushing to the market to beat rising rates (or the perception of rising rates).

Tags: , , , , ,


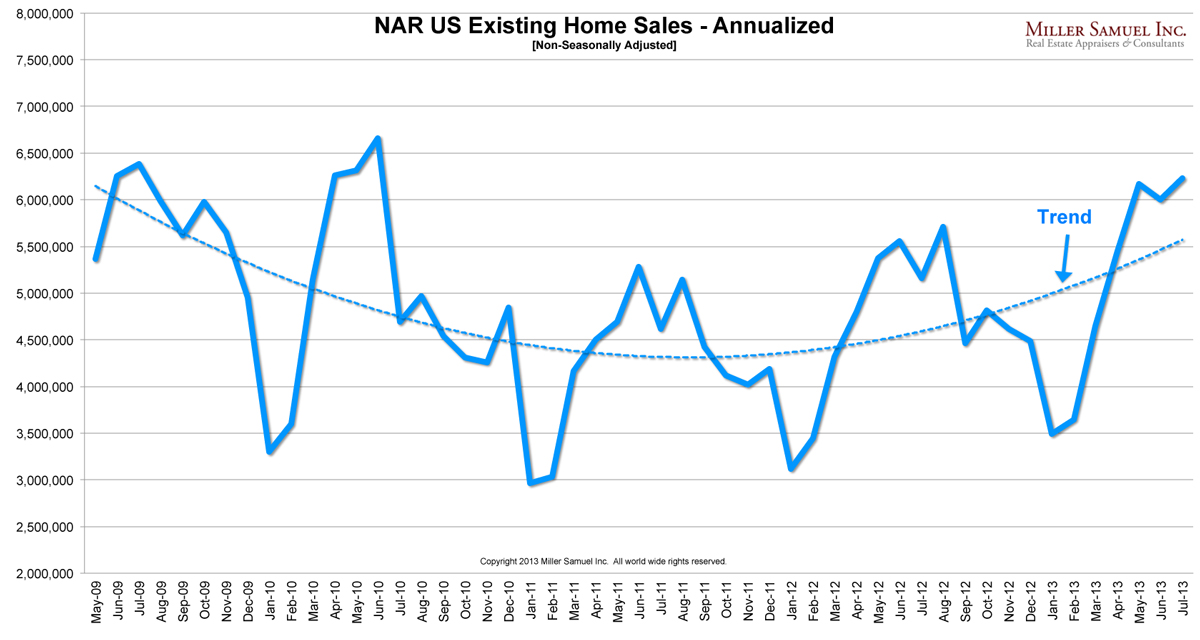
NAR July 2013 US Existing Home Sales Unexpectedly Rise 6.5% M-O-M

August 21, 2013 | 12:08 pm |


Source: NAR

After slipping in June, NAR’s Existing Home Sales for July jumped 6.5% unexpectedly from the prior month. Last month the results showed an slight decline (and were adjusted downward for this release) and the thinking was that the market is starting to cool off with the introduction of rising rates to the market in May. The bulk of May contracts probably closed in July, the likely basis of this most recent release. However it looks like the market continued to see a rise in demand in June, following the May bump in rates as people looked to get in the market before rates rose further.

Still, this month over month stuff is pretty ridiculous to place a lot of faith in. The year over year surge of 20.7% (non-seasonally adjusted) and 17.2% jump (seasonally adjusted) is much more telling of the long term market change.

Here are a few other charts to review. Inventory is much lower than a year ago while showing some gains in excess of seasonal trends. Median sales price growth is off the hook. 13.7% YoY growth is not sustainable with flat income, tight credit and high unemployment and underemployment. Thanks goodness for rising rates.


Source: NAR


Source: NAR

Tags: , ,

Get Weekly Insights and Research

Receive Jonathan Miller's 'Housing Notes' and get regular market insights, the market report series for Douglas Elliman Real Estate as well as interviews, columns, blog posts and other content.

Follow Jonathan on Twitter

#Housing analyst, #realestate, #appraiser, podcaster/blogger, non-economist, Miller Samuel CEO, family man, maker of snow and lobster fisherman (order varies)
NYC CT Hamptons DC Miami LA Aspen
millersamuel.com/housing-notes
Joined October 2007