Housing Pumpkin Spice In Your Kitchen
A colleague/friend complained about how early the Halloween decorations and all the pumpkin spice ads came out in the stores this year, finishing with a “Can you believe that?” – I nodded. At the same time, I was sipping on a Starbucks Pumpkin Spice Latte while eating a toasted pumpkin bagel covered with some fresh pumpkin butter. Now, don’t get me started on pumpkin pie…
View this post on Instagram
——————————————-
Did you miss last Friday’s Housing Notes?
September 29, 2023: Housing: Pay It Forward
But I digress…
Manhattan Prices Leveling Off As Listing Inventory Continues To Fall
I’ve been the author of the Douglas Elliman market report series since 1994 with the Manhattan report as the star product. It’s been a fun process in a market that, by definition, is dysfunctional.
Elliman Report: Q3-2023 Manhattan Sales
______________________________________________________
MANHATTAN SALES MARKET HIGHLIGHTS
Co-ops & Condos
“Prices are beginning to stabilize as listing inventory continues to fall.”
– Median sales price slipped annually at a diminishing rate for the fourth consecutive quarter but remained above pre-pandemic levels
– Sales declined annually, likely the last quarter of distortion caused by the spike in mortgage rates over the past year
– Listing inventory declined annually for the second consecutive quarter as would-be sellers remained wedded to their existing low mortgage rates
– Market share of bidding wars slipped to its second lowest level in ten quarters
– Market share of new development sales reached its highest level in over a year, well above the average for the decade
– The market share of cash buyers slipped to the third highest on record from the prior-quarter high
– Co-op median sales price rose year over year to a new record after falling annually in each of the prior three quarters
– Condo’s new development listing inventory declined year over year at a higher rate than resales
– New development average sales size fell annually for the fourth consecutive quarter
– Luxury median sales price rose year over year for the second straight quarter
– Luxury listing inventory declined year over year for the second time


More charts can be found in our library.
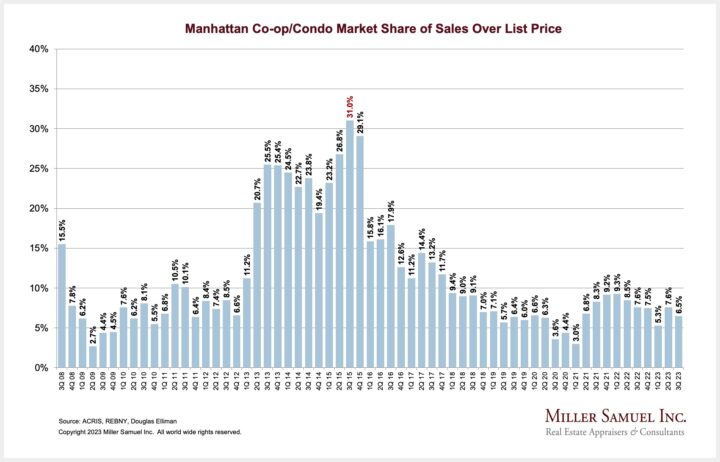
Manhattan Prices Get Back To (Nearly) Zero
Here’s a fun chart:

The Counselors of Real Estate™ Announce Their Top Ten Issues Facing Real Estate™
I’m a member of The Counselors and appreciate the shared insights from their membership, especially these top ten issues.
Here’s the release: Counselors Unveil Top Ten Issues Affecting Real Estate®
And a nifty video if you dare.

[click image to play]
The International View Of NYC’s Effective Removal Of Airbnb
I did an interview with a Barcelona TV station two weeks ago. I only appeared for a few seconds on the clip, but the international take on the new law really struck me. Airbnb was seen as a cheaper alternative to hotel stays for tourists and the fact that the hotel lobby really pushed the rule change (essentially emphasizing enforcement of landlord violators.
I made the point that people who live in the city are experiencing an affordability crisis, and Airbnb rentals take a lot of rentals off the market, driving rents higher. Douglas Elliman is publishing our rental research on Thursday.
Here’s a scary downside for the landlord of an Airbnb rental in California.
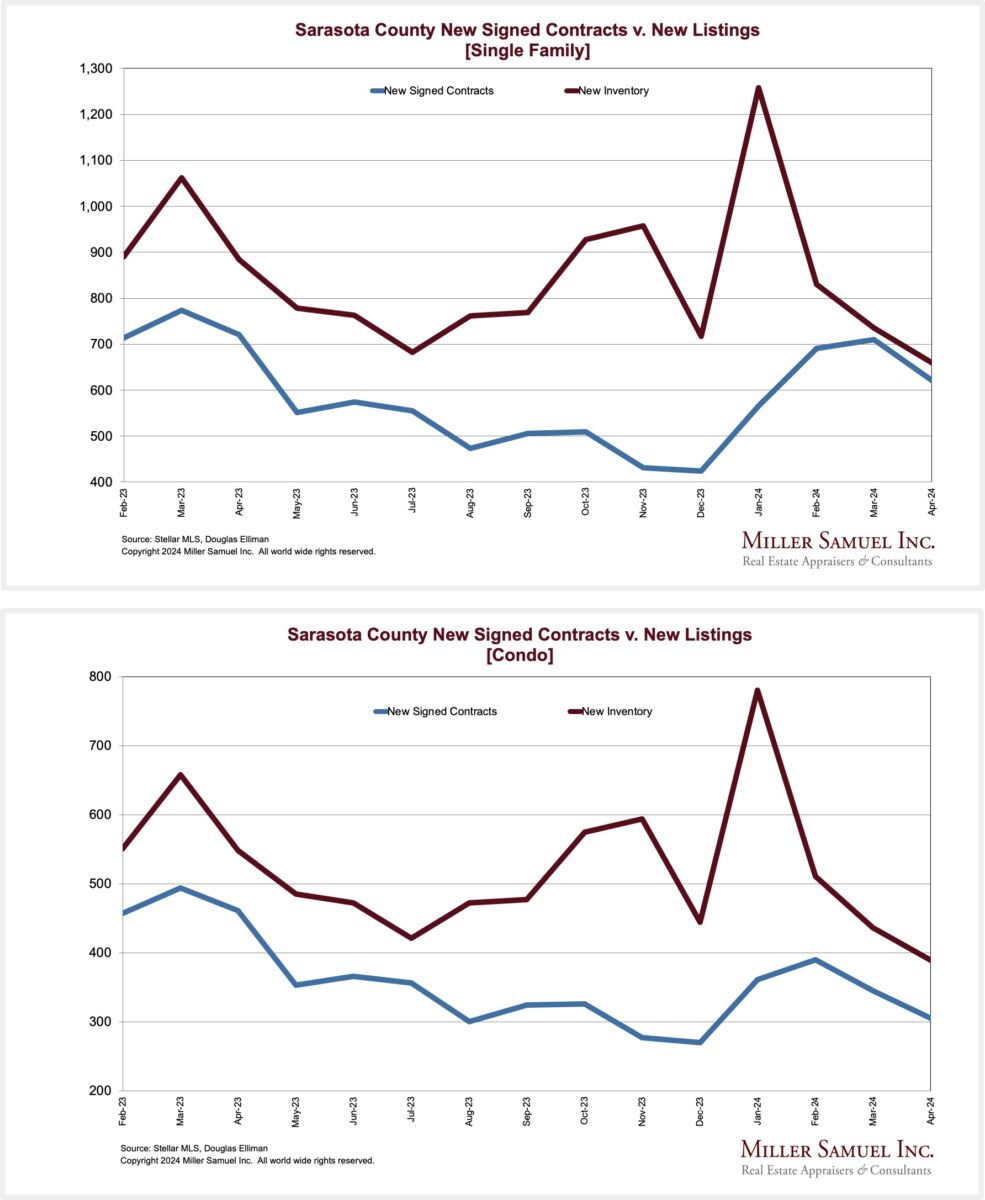
Regional New Signed Contract Reports Continue To Show The Chronic Lack Of New Listings
In our Douglas Elliman new signed contract reports across NYC Metro, Florida, and Southern California, we define “new listings” as only listings that entered the market during that month.
Elliman Report: September 2023 New York New Signed Contracts
Elliman Report: September 2023 Florida New Signed Contracts
Elliman Report: September 2023 California New Signed Contracts
Here are chart examples from markets across the three regions:


More charts can be found in our library.
Highest & Best Newsletter: Miami’s New Sky-High Splurge
I continue to love this new Florida newsletter: Highest & Best from Oshrat Carmiel, formerly of Bloomberg News…
Miami’s New Sky-High Splurge
A $50 million penthouse with a 1,000-foot view
If sold at the full asking price, the Waldorf penthouse would still fall short of the region’s most-expensive-ever condo sale of $60 million in 2015. And if you do some math, and divide the asking price by the apartment’s sheer size, it comes out to $3,800 per square foot — in line with what other rising high-end condos are seeking, Shear said.
And more homes are finally coming into the Miami market – here’s a chart I created using the data from our Elliman Report: September 2023 Florida New Signed Contracts

Let’s Talk About Mortgage Rate Vintages – Much Of It Is Too New To Be Drinkable


All those people with mortgages under 4% are not motivated to become buyers and, therefore, won’t be listing their homes for sale soon. This fact will be part of the housing market for the next few years.
Manhattan Buyers Are Getting Better At Pricing More Accurately And Adapting More Quickly
Here’s a new chart we will introduce into our regular quarterly releases. I’m often asked if would-be sellers are adapting to new market pricing. The answer now is “Yes.”
It looks like the properties are being priced more accurately in 2023, as evidenced by the drop in price cuts. A higher share of 2nd and 3rd cuts are also being made, inferring sellers are reacting more quickly to listings that are sitting – that the sellers are less in denial about the weaker conditions. It’s not a dramatic improvement but there is now evidence of movement.

Manhattan Maintenance Charges Are Up, Up, Up
The following charts are based on the monthlies of the units sold in the quarter, not the entire housing stock.
By square foot:

By monthly charge:

One of the reasons for the take-off since the pandemic era is the fact that larger, luxury apartments are selling more often than during the years prior to the pandemic. WFH has been good to the higher end market.
Getting Graphic
My favorite housing market charts of the week of our own making


_________________________________________________


My favorite housing market/economic charts of the week made by others


Apollo’s Torsten Slok‘s amazingly clear charts.


Kastle card swipe data charts
Remember that Kastle charts are overstating occupancy* because their pre-pandemic occupancy benchmark was 100%, which is simply incorrect (*measures card swipe activity as a proxy for occupancy).


My favorite random charts of the week made by others


Appraiserville
TAF: The USPAP Grifters Keep On Grifting (or is inflation now 40%?)
TAF just raised the cost of USPAP by 40%, presumably to make up for the four-year lag between updates because of COVID.
For the uninitiated, TAF is the organization that wrote the bat-shit crazy letter, the chickenshit letter and is the subject of an active investigation by HUD on whether USPAP promotes a lack of diversity in the appraisal profession (400th out of 400 occupations according to BLS in 2021).

Incidentally, I still can’t get the monthly TAF newsletter sent to my business email. Every week, loyal readers of Appraiserville forward it to me anyway. A board member worked on getting me access, and TAF staff sternly assured me that they hadn’t blocked me, although Dave said I had to subscribe with another email address. In other words, my business address is permanently barred from their system in some other way. Crazy right? A non-denial denial of access to resources that help inform the maintenance of my appraisal certification. It’s the lack of transparency and any lack of oversight that is going to bring down TAF as an institution eventually.
OFT (One Final Thought)
I will miss him – one of my favorite all-time players (along with Bubba Smith from my alma mater), and he had a pretty good Twitter account!
Post by @landofthe80sView on Threads
Brilliant Idea #1
If you need something rock solid in your life (particularly on Friday afternoons at 2 p.m.) and someone forwarded this to you, , or you think you already subscribed, sign up here for these weekly Housing Notes. And be sure to share with a friend or colleague if you enjoy them because:
– They’ll buy everything with pumpkin spice on top;
– You’ll buy everything with pumpkin spice on top;
– And I’ll be buying everything with pumpkin spice on top.
Brilliant Idea #2
You’re clearly full of insights and ideas as a reader of these Housing Notes. Please share them with me early and often. I appreciate every email I receive, as it helps me craft the following week’s Housing Note.
See you next week!
Jonathan J. Miller, CRE, Member of RAC
President/CEO
Miller Samuel Inc.
Real Estate Appraisers & Consultants
Matrix Blog
@jonathanmiller
Reads, Listens and Visuals I Enjoyed
- New Airbnb Regulations Shake Up New York City [The Real Deal]
- Trump-linked property-tax bills in Palm Beach County scrape $1.5M, but why isn’t Mar-a-Lago’s value higher? [Palm Beach Daily News]
- Too Many Vacant Lots, Not Enough Housing: The U.S. Real-Estate Puzzle [Wall Street Journal]
- How much is Trump’s Mar-a-Lago worth? It depends on who you’re asking [Palm Beach Daily News]
- Trump didn't make the cut for new Forbes 400, but 32 other Palm Beach billionaires did [Palm Beach Daily News]
- Severe Crash Is Coming for US Office Properties, Investors Say [Bloomberg]
- Manhattan Office Leasing Sinks 30% Despite String Of Big Deals [Bisnow]
- ICE (Black Knight) Mortgage Monitor: "Home Prices Set Yet Another Record in August" [Calculated Risk]
- Redfin, the Online Real Estate Broker, Leaves a Powerful Realtor Group [NY Times]
- How Katy Perry inspired a wave of housing bills [Semafor]
- What New York homeowners and renters should know about flood insurance. [NY Times]
- Watching the Southern Tip of Manhattan Change, for Forty Years [New Yorker]
My New Content, Research and Mentions
- Miami's New Sky-High Splurge [Highest & Best]
- Gramercy townhouse owned by Jackie O's favorite designer hits the market [Crain's New York]
- Oleg Cassini’s NYC Townhouse Listed for Sale at $13.95 Million [Bloomberg]
- Developers Are Hiring Private Security to Relocate Homeless People [The Messenger]
- Merchants at Chinatown's East Broadway Mall wonder if they'll survive after its rebirth [Gothamist]
- De Blasio nabs one-bedroom Manhattan bachelor pad — near rooftop bar where he had rendezvous with mystery woman [NY Post]
- Hamptons, North Fork Home Markets Go in Opposite Directions [The Real Deal]
- Real estate insiders question how Trump fraud judge valued Mar-a-Lago [CNN Business]
- Manhattan’s Median Home Price Rose 2% Despite Market Turbulence [Mansion Global]
- There's a shortage of luxury apartments in Manhattan, and it's driving up prices [CNBC]
- Supreme Court Crushes NYC Landlords’ Hopes [The Real Deal]
- Manhattan housing market stabilizing amid rising mortgage rates, modest inventory [Crain's New York]
- Manhattan, Brooklyn Home Listings Up But Contracts Flat [The Real Deal]
- Nova York vs. Airbnb: com afecta els veïns, els hotels i els turistes? [Telenotícies]
- Inside The Agency’s Arrival in The Hamptons [The Real Deal]
Recently Published Elliman Market Reports
- Elliman Report: Manhattan Sales 3Q 2023 [Miller Samuel]
- Elliman Report: California New Signed Contracts 9-2023 [Miller Samuel]
- Elliman Report: Florida New Signed Contracts 9-2023 [Miller Samuel]
- Elliman Report: New York New Signed Contracts 9-2023 [Miller Samuel]
- Elliman Report: Delray Beach Sales 2Q 2023 [Miller Samuel]
- Elliman Report: Deerfield Beach Sales 2Q 2023 [Miller Samuel]
- Elliman Report: Coral Gables Sales 2Q 2023 [Miller Samuel]
- Elliman Report: Boca Raton 2Q 2023 [Miller Samuel]
- Elliman Report: Manhattan, Brooklyn & Queens Rentals 8-2023 [Miller Samuel]
- Elliman Report: California New Signed Contracts 8-2023 [Miller Samuel]
Appraisal Related Reads
- 2023-24 Top Ten Issues Affecting Real Estate® [Counselors of Real Estate]
- The Pitfalls of Outlier Sales in Pricing a Listing [Linkedin]
- My Interview with the Senior Marketing Manager at CubiCasa [Cleveland Appraisal Blog]
- FNMA Continued Effort to Get Rid of Appraisers [Appraisers Blogs]
- Conservation Easements: Palpable Fraud or Honest Mistakes? A Federal Jury Returns a Split Verdict [JD Supra]


![[27 Speaks Podcast] Jonathan Miller Provides A 2024 Hamptons Outlook](https://millersamuel.com/files/2024/02/27eastlogo-600x314.jpg)