Yesterday was Groundhog Day, and this video doesn’t include a groundhog, but so what?
Best comedy ever
— Tansu YEĞEN (@TansuYegen) January 31, 2023
However, here are some Groundhog Day stats you might find useful if you’re on team Punxsutawney Phil:
Punxsutawney Phil’s Groundhog’s Day predications over the years… pic.twitter.com/gzNtTSjhao
— History Calendar (@historycalendar) February 2, 2023
But I digress…
The Manhattan Decade And Townouse Reports Are Once Again An Annual Compendium Of Market Data Goodness
I’ve been working on these Douglas Elliman “Decade” reports since about 1995 in one form or another and its always been satisfying to enable others to suss out market patterns if that’s your thing. Douglas Elliman liked the idea when I originally proposed it and look forward to it as a final recap of the just finished year.


_______________________________________________________________________
2013-2022 MANHATTAN DECADE HIGHLIGHTS (co-ops+condo)
Elliman Report: 2013-2022 Manhattan Decade Sales
“Despite doubling mortgage rates, sales only slipped, and listing inventory rose nominally higher.”
– Robust sales momentum in 2021 enabled sales to reach their second-highest total on record in 2022, despite the spike in mortgage rates
– Median sales price reached its highest level on record as average sales price reached the third-highest on record
– Listing inventory edged higher but was consistent with the two-decade average
– By bedroom, the median sales price rose annually across all sizes, with 4+ bedrooms seeing the most growth
– Sales expanded annually by bedroom for all sizes but studios and 2-bedrooms
– Listing inventory by bedroom expanded annually by size except for studios
_______________________________________________________________________
2013-2022 MANHATTAN TOWNHOUSE HIGHLIGHTS
Elliman Report: 2013-2022 Manhattan Townhouse Decade Sales
“The market ended the year with record prices, elevated sales, and listing inventory below pre-pandemic levels.”
– All price trend indicators rose annually and were higher than pre-pandemic levels
– While listing inventory rose annually, it remained below pre-pandemic levels
– Sales slipped from year-ago levels but were sharply higher than pre-pandemic levels
– Luxury price trend indicators increased annually and remained above pre-pandemic levels
– The number of luxury listings expanded year over year but remained well below pre-pandemic levels
– The average width of a luxury townhouse was the narrowest since 2014
– Single family sales slipped from last year’s record to the second-highest in twenty-five years of tracking
– The market share of townhouse sales as compared to total residential sales remained just above two percent
We Shouldn’t Inflation-adjust Housing Price Trends, But…
As a rule, you tend not to see housing price trends adjusted for inflation. Why? Because it’s kind-of double-counting since measurements of CPI is comprised of about 40% housing.
But still, I like to check in now and then to get some context, and we see that prices just before the 2018 federal SALT tax and the 2019 mansion tax were about the same as the Housing Bubble era. Prices during the pandemic era were lower than during the housing bubble era. Fascinating.

Hamptons & Long Island Decade Sales Reports Are Released
These Douglas Elliman reports we prepare provide a braoder context to market trends using a ten-year moving window.


_______________________________________________________________________
2013-2022 HAMPTONS/NORTH FORK HIGHLIGHTS
Elliman Report: 2013-2022 Hamptons/North Fork Decade Sales
– Listing inventory rose annually to the second-lowest level on record to less than half of pre-pandemic levels
– While sales dropped from the prior year’s total, the total was similar to the pre-pandemic total
– Price trend indicators rose year over year to the highest levels on record
– Days on Market fell to a record low during sixteen years of tracking
– Despite the slowdown in sales as mortgage rates doubled, there was no listing discount
– The pace of the market, as measured by months of supply, was significantly faster than the decade average
_______________________________________________________________________
2013-2022 LONG ISLAND HIGHLIGHTS
Elliman Report: 2013-2022 Long Island Decade Sales
– Price trend indicators rose year over year to the highest levels on record
– Listing inventory rose annually to the second-lowest level on record to nearly half of pre-pandemic levels
– While sales slid from the prior year’s total, the total was slightly below the pre-pandemic total
– The pace of the market, as measured by months of supply, was the second-fastest on record
– Days on Market fell to a record low during two decades of tracking
Long Island Showed Faster Growth In Decade After Pandemic Started
Newsday, the largest newspaper on Long Island, covered our Elliman Report for the Long Island Decade and most importantly, used charts!
Long Island home prices increased 66% since 2013 [Newsday]


NYC Transit Project Gets Completed 14 Years Late
Despite being wildly late and wildly over budget, East Side Access, this new feature of our transit system is going to be helpful to the city, enabling greater connectivity. I’m going to be on the lookout for its impact to housing patterns over the next several years, especially on the east side of Manhattan.
Vice wasn’t so enthusiastic about it with: New York City Completes Construction on Latest American Transit Disaster
But as far as news on the topic, this was my favorite item of the announcement.
PUN OF THE DAY 'Don't take spell check for granite!' Artist's name misspelled on plaque at new Grand Central terminal @DailyMail @grayneirin https://t.co/jYfAwO5ui0 pic.twitter.com/psKtlZ8O11
— Jonathan Miller (@jonathanmiller) February 1, 2023
Southampton Press Nails The Drop In Sales/Listing Inventory As The Key Narrative To The East End Slowdown
Using our charts in their piece, Hamptons Home Sales Drop in Fourth Quarter as Low Inventory Bolsters Prices they make a compelling story.


Junkstats But Fun: North American Shares Moving Data
Even though these moving companies recognize the value of migration data for PR hits, understanding credible patterns of actual migration using many public data sources are problematic. So we resort to crayon visualizations. Sigh.
North American Moving Services has a visualization by the state that was widely shared: National Movers Study. As a kid, I always remembered them as advertisers on shows like The Price Is Right (I think that’s the one).
What really threw me off initially was the red and blue colors of their logos to reflect in bound and outbound migration. Yet they seem to reflect the reverse of the political colors we associate with the states I looked at. If we correlate the migration patterns in New York State for example, there must be only a handful left despite record residential demand!


NY Governor Hochul 421-a Tax Abatement Extension Explainer
The 421-a tax abatement has been an important incentive for residential development over the past several decades. Real Estate reporter at Crain’s, Natalie Sachmechi posts a helpful explainer (you have to be a member of LinkedIn):
Worrying About Boulders & Housing?
I have to admit, I’ve been worried about trees falling on my houses over the years and have had several close calls. But I’ve never worried about boulders…until now.
January 2023 New Signed Contracts Start To Show Some Upward Lift
I began authoring the Douglas Elliman new signed contract report series during the pandemic and they cover submarkets of four U.S. regions, including New York, Florida, Colorado and California. Here are the result summaries with a couple of charts for each region. More charts are available in our chart gallery.
______________________________________________________
New York New Signed Contracts Report
– The New York report attached covers Manhattan, Brooklyn, Long Island, Hamptons, North Fork, Westchester County, Fairfield County, and Greenwich, CT.
Manhattan
Newly signed contracts declined month over month for the second time in four months as new listings expanded for the first time since September. However, annually, the decline in newly signed contracts has been partially offset by significant decreases in new listings.
Brooklyn
Newly signed contracts declined month over month for the second time in five months as new listings expanded for the first time since September. However, on an annual basis, the decline in newly signed contracts has been partially offset by significant decreases in new listings.
Long Island (excluding H/NF)
New signed contracts expanded month over month for the first time since August as new listings rose for the first time since May. The annual decline in new listings has partially offset the year over year fall in newly signed contracts since the summer.
Hamptons
New signed contracts expanded month over month for the first time since September as new listings rose for the first time since October. The annual decline in new listings has partially offset the year over year fall in newly signed contracts since the summer.
North Fork
Newly signed contracts decreased month over month for the fourth consecutive month as new listings rose for the second time in three months.
Westchester
Newly signed contracts have decreased month over month since May as new listings rose for the first time since June.
Fairfield
New signed contracts expanded month over month for the first time since May as new listings rose for the first time since June.
Greenwich
Newly signed contracts decreased month over month for the third consecutive month as new listings rose for the first time since September.

______________________________________________________
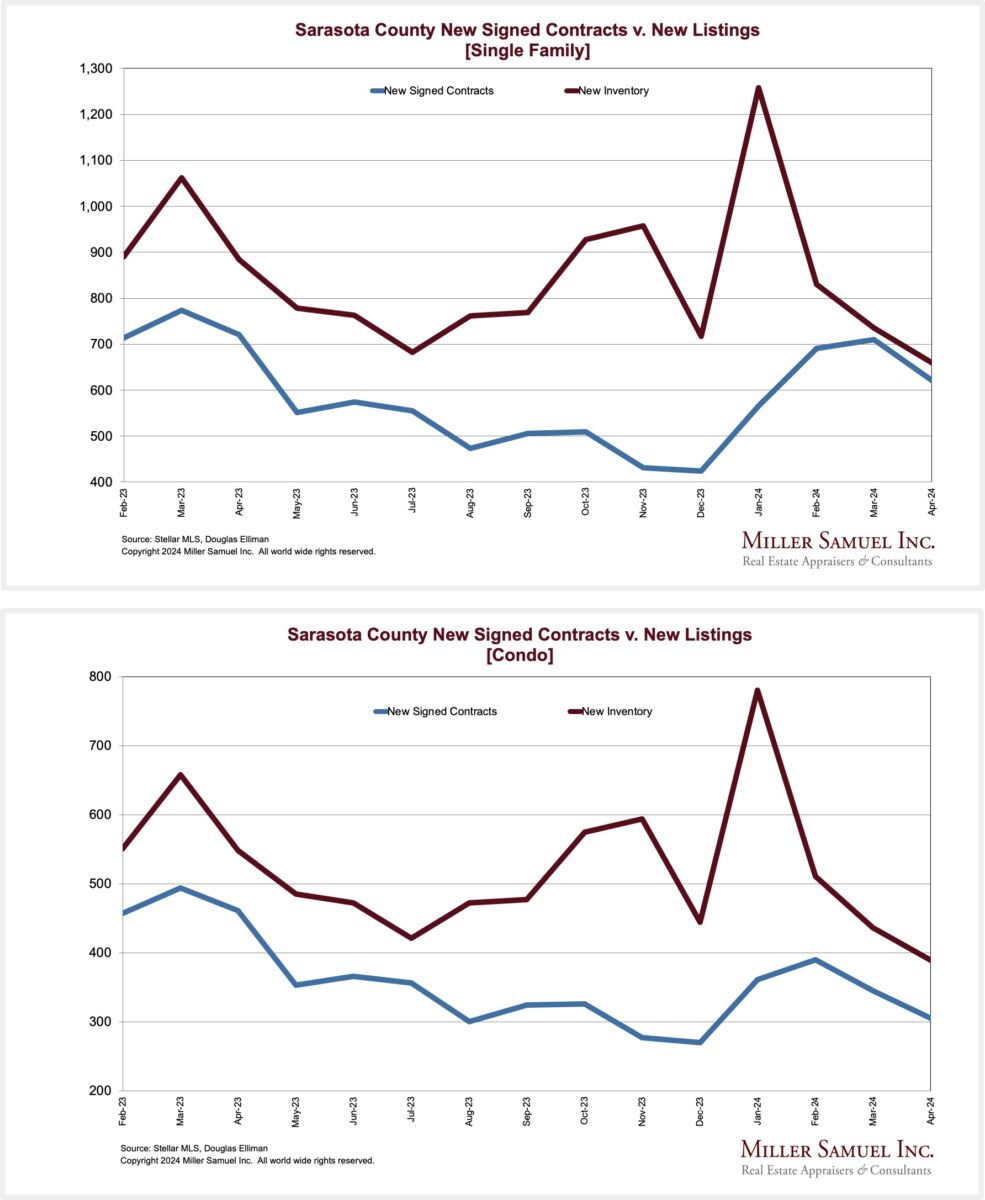
Florida New Signed Contracts Report
– The Florida report includes the counties of Duval (New), St. Johns (New), Miami-Dade, Broward, Palm Beach, Pinellas, Hillsborough, and Collier (New).
Duval County
Newly signed contracts rose year over year for the second consecutive month, while new listings expanded for the first time since July.
St. Johns County
New signed contracts expanded month over month for the first time since July as new listings rose for the second time since July.
Palm Beach County
New signed contracts expanded month over month for the second time since August as new listings rose for the first time since October.
Broward County
New signed contracts expanded month over month for the first time since July as new listings rose for the second time since June.
Miami-Dade County
Newly signed contracts have declined monthly since August as new listings fell every month since June. However, the decline in new contracts has primarily been partially offset by the sharp drop in new listings since the summer.
Pinellas County
New signed contracts expanded month over month for the first time since August as new listings rose for the first time since October. However, the decline in new contracts has largely been partially offset by the sharp drop in new listings since the summer.
Hillsborough County
New signed contracts expanded month over month for the first time since August as new listings rose for the first time since July. However, the decline in new contracts has largely been partially offset by the sharp drop in new listings since the summer.
Collier County
New signed contracts expanded month over month for the second time since August as new listings rose for the third time in four months.

______________________________________________________
Colorado New Signed Contracts Report
– The Colorado report covers Aspen, Snowmass Village, Basalt, Carbondale, and Missouri Heights.
Aspen
Newly signed contracts have expanded sharply month over month for the past two months, while new listings have fallen for the first time in three months. The decline in new listings has partially offset the fall in newly signed contracts since the summer.
Snowmass Village
Newly signed contracts have expanded sharply month over month for the past two months, while new listings have fallen for the fourth time in six months. The decline in new listings has partially offset the fall in newly signed contracts since the summer.
Basalt
Newly signed contracts haven’t seen a monthly decline in four of the past six months, while new listings have fallen every month since August. The limited decline in new contracts has been significantly overpowered by the sharp drop in new listings since the summer.
Carbondale
Newly signed contracts declined month over month for the past two months but were offset by the significant decline in new listings since July.
Missouri Heights
Newly signed contracts declined month over month but were significantly offset by the matching drop in new listings, keeping the pace of the market firm.

______________________________________________________
California New Signed Contracts Report
– The California report contains the counties of Los Angeles, Orange, and San Diego.
Los Angeles County
New signed contracts expanded month over month for the first time since August as new listings rose for the first time since June. The decline in new listings has primarily offset the fall in newly signed contracts since the summer.
Orange County
New signed contracts expanded month over month for the first time since August as new listings rose for the first time since July. The decline in new listings has primarily offset the fall in newly signed contracts since the summer.
San Diego County
New signed contracts expanded month over month for the first time since August as new listings rose for the first time since June. The decline in new listings has primarily offset the fall in newly signed contracts since the summer.

Getting Graphic
My favorite charts of the week of our own making


My favorite housing market/economic charts of the week made by others
Job openings are moving in the wrong direction, heading up to 11 million when they were expected to drop. This speaks to the tightness in the labor market at a time when the Fed views this as key to inflation. pic.twitter.com/qDEK2Id83Y
— Lisa Abramowicz (@lisaabramowicz1) February 1, 2023


The persistent labor market imbalance is what’s keeping the Fed from pausing. There are almost two job openings for every unemployed American (the ratio increased in December). pic.twitter.com/2JlW2z55GN
— (((The Daily Shot))) (@SoberLook) February 2, 2023
My favorite random charts of the week made by others
"correlation isn't causation" but sometimes the correlation is hitting you over the head pic.twitter.com/oFv8B9hEJJ
— Alec Stapp (@AlecStapp) February 1, 2023


What’s the most misleading chart you’ve ever seen? I’ll go first. pic.twitter.com/vWSBByV3Cu
— Dare Obasanjo (@Carnage4Life) February 2, 2023
HGAR & One Key: Getting the Deal Done: Crunching the Numbers: Buy, Hold or Sell?
This webinar should be fun and insightful. This is my third or fourth time in this series. I know the panelists and all are top-notch. Its free and there are only 300 tickets available so you might want to sign-up now!

Appraiserville
(For earlier appraisal industry commentary, visit my old clunky REIC site.)
AI BOD Removes Chair and Vice Chair From Audit Committee After One Month On The Job
The cleanup of FOJs begins, this time with the all-important Audit Committee. For those unaware, the Audit Committee is one of the most critical positions in the organization because they genuinely see how the sausage is made. They can fire the CEO for cause, investigate the c-suite using outside counsel, manage reputational risk, handle sensitive matters, and review contracts, among other responsibilities. There are five audit board members, and to be Chair/Vice Chair, they must have served on the committee.
Here is the Audit Committee on Monday, January 30, 2023:

And here is the Audit Committee on Thursday, February 2, 2023:

Note that Elaine Liz-Ramirez and Trevor C. Hubbard have been stripped of their titles by the board of directors and Michael Tankersley was installed as Chair yet hasn’t served on the committee before, inconsistent with past practice. If you’ll recall, “Tank” was more than happy to put aside ethics to be Jim Amorin’s lackey when the initial Sham Petition Process of its current 3-year run was used. Still, he lost to current president Craig Steinley, likely the ultimate reason JA resigned because you probably guessed…Craig was on the Audit Committee and likely knows where JA’s bodies are buried.
I cannot understate how big a deal it is to have the leadership of this committee removed by the board of directors so suddenly and without fanfare. Leaders of the Audit Committee must be beyond reproach in their ethics and moral standing. I can only speculate that this severe shaming of these two members has something to do with JA’s wildly high compensation package, as was determined when I used industry “comps,” as any residential appraisal knows how to do. However, it is of great concern that “Tank,” who was a reliable go-to FOJ, taking advantage of the Sham Petition Process without hesitation, was installed as Chair without any experience in such a pivotal committee. Last year JA had a quorum over the committee. The politics are beyond my comprehension, but elements of the FOJ stain remain on the organization in leadership. All of you who didn’t drink the JA Kool-aid, expecting a quid-pro-quo such as a choice teaching assignment, a key committee placement, flying first class to BS international conferences with their emotional support spouses that come out of the hides of our membership, must be vigilant to help this once-proud organization to be restored to respectability and relevance again. Keep your eyes on “Tank” and other FOJs looking to be rewarded based on their past actions. They picked the wrong side of history and should not have any role in the organization’s future.
AI FOJ Sycophants Beware: Elvis Has Left The Building
I hear JA is having regrets about his decision to resign. He even gave himself an “Of Counsel” title which to my understanding, only applies to lawyers, which I don’t believe JA is? Perhaps making up a title can ease the pain, but he’s out in less than two weeks and can keep the title for as long as he wants. Who cares? After all, it says something about the type of person who would use a made-up title that misrepresents their position.
One more point about JA. We all have to acknowledge JA’s unique ability to take over an organization’s leadership – he was very skilled at that in a bad way, as I’ve extolled here early and often. To those members who opted to be sycophants in search of quid-pro-quo perks at the expense of the membership, you better start making alternative plans because “Elvis has left the building.” The oxygen for those self-serving lemmings is largely gone, and the focus seems to be returning to the needs of membership. Good.
A reminder from this dark era of AI history
The AI Board of Directors serves AI Membership and the AI C-suite Serves the AI Board of Directors. That’s it!
Voice of Appraisal Podcast: Phil Crawford on Courage and Survival in 2023!
It’s the 9th Year of Voice of Appraisal. Who among you projects such enthusiasm with such a sweet syrupy radio voice? Always a fun and informative listen.
OFT (One Final Thought)
We often need subtitles on our videos. I find myself doing that and chalked it up to too much loud music in my teens. But here’s a great explainer on why.
Brilliant Idea #1
If you need something rock solid in your life (particularly on Friday afternoons) and someone forwarded this to you, , or you think you already subscribed, sign up here for these weekly Housing Notes. And be sure to share with a friend or colleague if you enjoy them because:
– They’ll be ready for groundhog day;
– You’ll be wary of otters on rafts;
– And I’ll let go of the boulders.
Brilliant Idea #2
You’re obviously full of insights and ideas as a reader of Housing Notes. I appreciate every email I receive, and it helps me craft the following week’s Housing Note.
See you next week.
Jonathan J. Miller, CRE, Member of RAC
President/CEO
Miller Samuel Inc.
Real Estate Appraisers & Consultants
Matrix Blog
@jonathanmiller
Reads, Listens and Visuals I Enjoyed
- Frank Lloyd Wright’s One-of-a-Kind Circular Sun House Lists in Arizona [Dirt]
- LA’s Active Resi Agent Pool Shrinks 27% as Market Slows [The Real Deal]
- The Fed slows rate increases, but signals more to come. [NY Times]
- Inflation Adjusted House Prices 3.6% Below Peak [Calculated Risk]
- Billionaire Ken Griffin Wants to Move a Historic Home off His Miami Property. Preservationists Aren’t Happy. [Wall Street Journal]
- Pending Home Sales Increased 2.5% in December, Ending Six-Month Slide [NAR]
- 2022 U.S. Moving Migration Patterns Report [North American Van Lines]
- Welcome to Neom, Saudi Arabia’s desert dystopia in the making [Prospect Magazine]
- Wall Street Is Losing Out to Amateur Buyers in the Housing Slump [Bloomberg]
- Steve Roth Flips Bernie Madoff’s Former Montauk Home [The Real Deal]
- US population center trending toward South this decade [AP News]
My New Content, Research and Mentions
- In Some Buildings, Dogs Go Out With the Trash [NY Times]
- Hamptons, North Fork Home Markets Tight but Improving [The Real Deal]
- Manhattan, Brooklyn Home Listings Rise for First Time in Months [The Real Deal]
- Price Growth for Manhattan’s Luxury Co-ops and Condos Outperformed the General Market Over the Last Decade [Mansion Global]
- Long Island home prices increased 66% since 2013 [Newsday]
- Hamptons Home Sales Drop in Fourth Quarter as Low Inventory Bolsters Prices [27 East]
- Luxury developers in Los Angeles bet someone will pay record prices for these condos [CNBC]
- What ‘days on market’ really tells you about pricing, discounts, and negotiability [Brick Underground]
- Long Island City Condo Market Saw Price Increases and Robust Sales in 2022: Report [LIC Post]
- With Homes, Fear of Missing Out is Now Fear of Paying Too Much [GlobeSt]
Recently Published Elliman Market Reports
- Elliman Report: Hamptons/North Fork Decade 2013-2022 [Miller Samuel]
- Elliman Report: Long Island Decade 2013-2022 [Miller Samuel]
- Elliman Report: Manhattan Townhouse 2013-2022 [Miller Samuel]
- Elliman Report: Manhattan Decade 2013-2022 [Miller Samuel]
- Elliman Report: Colorado New Signed Contracts 1-2023 [Miller Samuel]
- Elliman Report: California New Signed Contracts 1-2023 [Miller Samuel]
- Elliman Report: Normandy Isles/Normandy Shores New Signed Contracts 1-2023 [Miller Samuel]
- Elliman Report: Florida New Signed Contracts 1-2023 [Miller Samuel]
- Elliman Report: New York New Signed Contracts 1-2023 [Miller Samuel]
- Elliman Report: San Diego County Sales 4Q 2022 [Miller Samuel]
Appraisal Related Reads
- The US Real Estate Appraisal Industry is Expected to Reach $11.41 Billion in 2028 [Businesswire]
- FEBRUARY NEWSLETTER: Sharing our work [The Appraisal Foundation]
- Fastapp AMC Alleged Violations of Appraiser Independence [Appraisers Blogs]
- Appraiser Countersues Black Plaintiffs Who Alleged Discrimination [Working RE]
- Thanks to my friends at the Yolo Association of Realtors [Joseph Lynch Appraisal]
- Appraiser Countersuing Black Homeowners for Defamation [Appraisers Blogs]
- Housing Market Down But Not Out- January Newsletter [DW Slater Company Blog]
- The housing market went from an ice bath to a hot shower [Sacramento Appraisal Blog]
- Tom Horn on LinkedIn: House Measurement by Property Data Collector Gone Wrong [Linkedin]
- “I can shop it around.” Is Valuation Independence Good or Bad for Business? (Part 1) – Christensen Law Firm [Valuation Legal]
Extra Curricular Reads
- Brooklyn Resident Hamilton Leithauser Accidentally Receives Mystery Person's Ashes [Stereogum]
- Name a Cockroach After Your Ex, and This Zoo Will Feed It to an Animal [CNET]
- 8 Secret Features of Grand Central Terminal [History]
- The company that created ChatGPT is releasing a tool to identify text generated by ChatGPT [QZ]
- A Steve Jobs Opera Is Coming to San Francisco [SF Standard]
- The Laundress Was Supposed to Be the Nice Detergent [The Cut]
- Here’s Why Everything at Walgreens Is Suddenly Behind Plastic [Curbed]
- The ‘Enshittification’ of TikTok [Wired]
- Television's Marquee Moon: The Story of a Band, City, and Guitar Rock Masterpiece [Consequence]
- Tom Verlaine, singer and guitarist for seminal art-punk band Television, dies at 73 [LA Times]


![[27 Speaks Podcast] Jonathan Miller Provides A 2024 Hamptons Outlook](https://millersamuel.com/files/2024/02/27eastlogo-600x314.jpg)