_Getting Graphic is a semi-sort-of-irregular collection of our favorite BIG real estate-related chart(s)._
In Floyd Norris’ [Many Homes Are on the Market and Sales Numbers Are Declining [NYT]](http://www.nytimes.com/2006/07/29/business/29charts.html?n=Top%2fNews%2fBusiness%2fColumns%2fFloyd%20Norris) he recaps the release of recent home sale data this week which basically said that the number of homes, while still near record levels, can’t keep up with the number of homes being added to inventory.
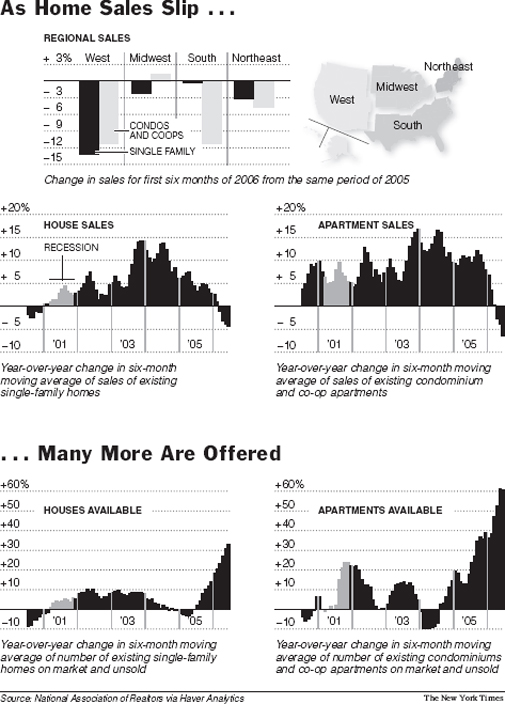
Sales of 1-family homes are down 4.4% over last year while their inventory is up 33%. Co-ops and condos are down 6.6% and inventory is up 61%.
For the past six months, I have been saying that this summer, or the 3Q 2006 will likely be the bellweather for what the real estate market is really doing. The 2Q 2006 market sees the largest increase in the number of sales and price appreciation. Floyd Norris is really saying the same thing. We can now get to the bottom (literally?) of the whole question which is, what is going to happen to the real estate market?
>WHEN the American economy fell into recession five years ago, it was the strength of the housing market that kept the downturn short and mild. Home sales kept rising throughout the downturn, and then took off when the recession began.
>But now home sales are falling and the number of unsold homes is at the highest level ever. Housing starts are starting to fall, but remain at a high level by historical standards. If sales do not pick up this summer, when sales are usually seasonally strong, it could be a sign that prices are going to come under pressure and lead to a much larger decline in housing starts.